
| Tool | Best for | Price | South African university availability | Learning curve |
|---|---|---|---|---|
| GenStat | Randomised block, split-plot and other classical field-trial designs; the tool most agronomy supervisors were trained on | Paid; annual academic licence, typically bundled through the faculty | Commonly licensed by agricultural faculties for student use — check with your department before buying your own copy | Moderate; menu-driven with a scripting option once you need it |
| R (with agricolae and emmeans) | The same classical designs as GenStat, plus mixed models, meta-analysis and anything not menu-driven | Free, always | Available everywhere; no faculty licence needed | Steep at first if you have never coded; the agricolae package flattens the field-trial-design curve considerably |
| SPSS | Simpler comparative designs and any survey component of a mixed agricultural-economics study | Paid, but most universities provide a student licence at no extra cost | Widely licensed across South African universities, including for agriculture faculties with an economics or extension component | Gentle; the interface generalist social-science supervisors and co-supervisors already know |
| QGIS | Soil, land-use and spatial variability mapping; precision-agriculture and remote-sensing components | Free, always | Available everywhere; some departments also license ArcGIS, which does the same job at real cost | Moderate; spatial concepts take longer to learn than the software itself |
| DSSAT / APSIM (crop simulation) | Crop-growth modelling and climate-scenario studies rather than a physical field trial | Free (research and education licence) | Used in specific crop-modelling groups rather than department-wide; ask your supervisor whether your group has an established workflow | Steep; usually only taken on with direct supervisor guidance already in place |
An agricultural sciences thesis in South Africa almost always needs two categories of software rather than one: something to design and analyse a field, glasshouse or animal trial, and, increasingly, something to handle spatial or remote-sensing data if your study has a land, soil or precision-agriculture component. Five tools cover the ground most honours, master’s and early doctoral studies actually need.
GenStat: the tool most agronomy departments were built around
GenStat was developed originally for agricultural trial analysis and its design-of-experiments module still reflects that history more directly than any general-purpose statistics package: randomised complete block designs, split-plot and strip-plot designs, and Latin square layouts are built in as named procedures rather than something you assemble from general linear-model building blocks. If your supervisor trained on GenStat, which many South African agronomy and soil science supervisors did, working in the same tool your supervisor reads output in removes a layer of translation from every meeting. Check with your faculty first: many agricultural science departments hold a site licence that covers registered postgraduates, which is the only economical way to access it, since an individual academic licence is a real annual cost most students should not carry alone.
Who it suits
A classical field, glasshouse or animal trial with a standard experimental design, in a department that already licenses GenStat and where your supervisor works in it.
R with agricolae and emmeans: the free equivalent, and more besides
R does everything GenStat does for classical trial designs, at no cost, once you install the agricolae package, which is built specifically for agricultural field-trial design and analysis — randomisation, design generation and the corresponding ANOVA in one workflow — and emmeans, which handles the estimated marginal means and post-hoc comparisons every trial’s results section eventually needs. Where R pulls ahead of GenStat is anything beyond the classical design: mixed models with random effects for multiple trial sites or years, meta-analysis combining several seasons of data, or a Bayesian approach if your department supports it. The cost is a steeper initial learning curve if you have never written code before, though agricolae’s design functions are close enough to a menu system that many students manage the trial-design half comfortably even as beginners.
SPSS: the right choice for a mixed agricultural-economics study
SPSS rarely leads an agronomy thesis, but it is frequently the right tool for the economics, extension or adoption-survey component of a mixed agricultural sciences study — a farmer-adoption survey analysed alongside a smaller physical trial, for instance. Most South African universities provide a student SPSS licence at no direct cost, and if your co-supervisor sits in an agricultural economics or extension department, working in the tool they already read output in again saves translation time. It is not built for trial design the way GenStat and agricolae are, so treat it as the survey-analysis half of a mixed study rather than the whole toolkit.
Who it suits
The survey or adoption-analysis component of a mixed-methods agricultural sciences thesis, run alongside GenStat or R for the trial component.
QGIS: free spatial analysis for soil, land-use and precision agriculture
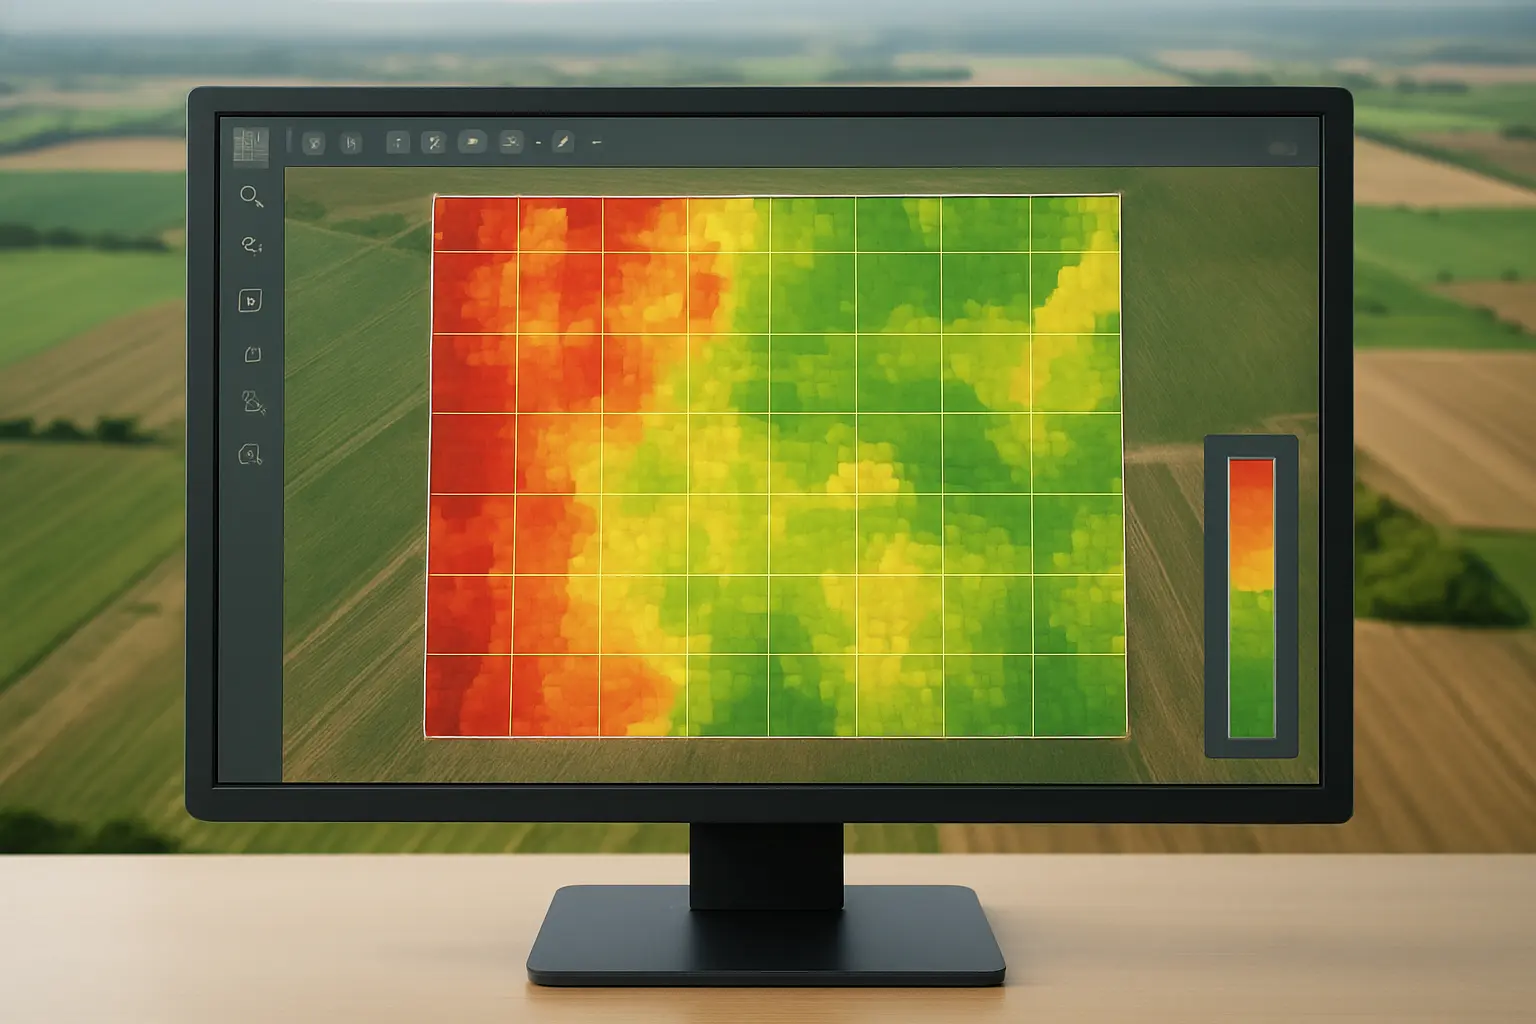
Any thesis with a spatial dimension — soil property mapping across a farm, land-use change analysis, yield-variability mapping from a precision-agriculture dataset, or basic remote-sensing work with satellite imagery — needs a geographic information system, and QGIS does the job at no cost, with an active plugin ecosystem that covers most of what a postgraduate study needs without ever touching the commercial alternative. ArcGIS remains common in industry and some departments do license it, so if your faculty already provides ArcGIS seats and your supervisor works in it, there is no strong reason to switch; but a student starting from nothing should default to QGIS rather than paying for or waiting on an ArcGIS seat that may not be available every semester.
Who it suits
Any thesis with a soil, land-use, precision-agriculture or remote-sensing component, regardless of which statistics package handles the trial data.
DSSAT and APSIM: crop simulation, only with supervisor guidance already in place
If your thesis models crop growth or yield response under different climate or management scenarios rather than measuring a physical trial directly, DSSAT (Decision Support System for Agrotechnology Transfer) and APSIM (Agricultural Production Systems sIMulator) are the two crop-simulation platforms most commonly used internationally and, in specific South African research groups, locally. Both are free for research and education use, but neither is a tool to pick up independently partway through a thesis: calibrating a crop model to local soil and climate data is specialist work, and departments that use these platforms almost always already have an established workflow, a calibrated parameter set and a supervisor who can hand you a starting point. If your department has no existing crop-modelling group, a first-time model calibration is rarely a realistic addition to a single thesis timeline.
Who it suits
A crop-modelling or climate-scenario study in a department with an existing DSSAT or APSIM workflow and a supervisor already working in that platform.
The recommendation
Default to R with agricolae and emmeans for trial design and analysis unless your department already licenses GenStat and your supervisor works in it — in which case use what your supervisor reads, since a shared tool speeds up every supervision meeting. Add QGIS the moment your thesis touches soil, land-use or spatial data of any kind, at no extra cost. Bring in SPSS only for a survey or adoption-analysis component alongside your trial data, and only attempt DSSAT or APSIM if your department already has the workflow built. The statistical logic behind choosing an analysis once your design is set follows the same test-selection reasoning covered in our guide to which statistical test to use for a dissertation, applied here to trial data rather than survey responses.
Mistakes that cost students the most time
Three patterns account for most of the wasted weeks students report with an agricultural sciences tool stack. The first is choosing a tool before the experimental design is finalised, then discovering the chosen software handles the design poorly — decide your design first, in consultation with your supervisor, and let the design determine the tool rather than the reverse. The second is starting to learn R for the first time during data collection rather than before it, which means the field season’s data sits unanalysed while the learning curve is climbed under deadline pressure; build in the two to three weeks of practice this article recommends before your trial begins, not after. The third is treating a spatial component as an afterthought bolted onto the write-up stage — if soil or land-use variability genuinely matters to your research question, plan the GIS data collection (coordinates, sampling grid, imagery access) alongside your physical trial from the start, since retrofitting spatial data after fieldwork is finished is rarely possible.
All three mistakes share a root cause: the tool decision made too late, after the design was already set in motion. Settle your design, your tool and your data-collection plan together, before the first sample is taken.
Drafting the methods section once your tool stack is settled
Choosing between five tools with different licensing, cost and learning curves is exactly the kind of decision that eats a week a South African postgraduate does not have. Tesify drafts the methods and analysis section once you have picked your tools, keeps the terminology consistent with the package you actually used, and flags where a design choice needs a citation to the method it follows. There is a free plan.
Draft your agricultural sciences methods chapter with Tesify
If your study also needs South African datasets rather than only analysis tools, the same custodian-and-access discipline used for public health and education research in our guides to public health dissertation data sources applies to agricultural datasets held by Stats SA and the Department of Agriculture, and the honours-to-doctorate scoping question is covered in the difference between an honours report, a master’s dissertation and a doctoral thesis.
Frequently asked questions
Is GenStat worth buying if my department does not license it?
Rarely, for a single thesis. R with agricolae does the same classical trial designs at no cost, and the time spent learning R transfers to the rest of your postgraduate and professional career in a way a personal GenStat licence does not.
Can I use Excel for a randomised block design analysis?
You can build a basic ANOVA table in Excel, but it will not generate the randomisation, handle a split-plot or strip-plot layout, or produce the post-hoc comparisons examiners expect to see reported correctly. Use it for data entry and simple visual checks, not for the analysis itself.
Do I need QGIS if my whole thesis is a single-site glasshouse trial?
No. QGIS earns its place only when spatial variation across a field, farm or landscape is part of your research question. A controlled single-site glasshouse trial has no spatial component to map.
Which package do South African agricultural economics theses typically use?
SPSS and Stata both appear regularly for survey-based agricultural economics work, alongside R for anything requiring more flexible modelling. Ask your specific department or co-supervisor which one their group standardises on before committing.
Is R difficult to learn with no coding background?
It has a real learning curve, but agricolae’s design functions are close to formulaic once you have a working example to adapt, and free short courses and departmental workshops are common at South African universities. Budget two to three weeks of steady practice before your data collection begins, not during your results deadline.
Can I switch from GenStat to R partway through my thesis?
Yes, the underlying statistical methods (ANOVA, mixed models) transfer directly, though the output format and some default settings differ, so re-verify your results against a known example before trusting a switched analysis. Most students who switch do so before data collection, not after.