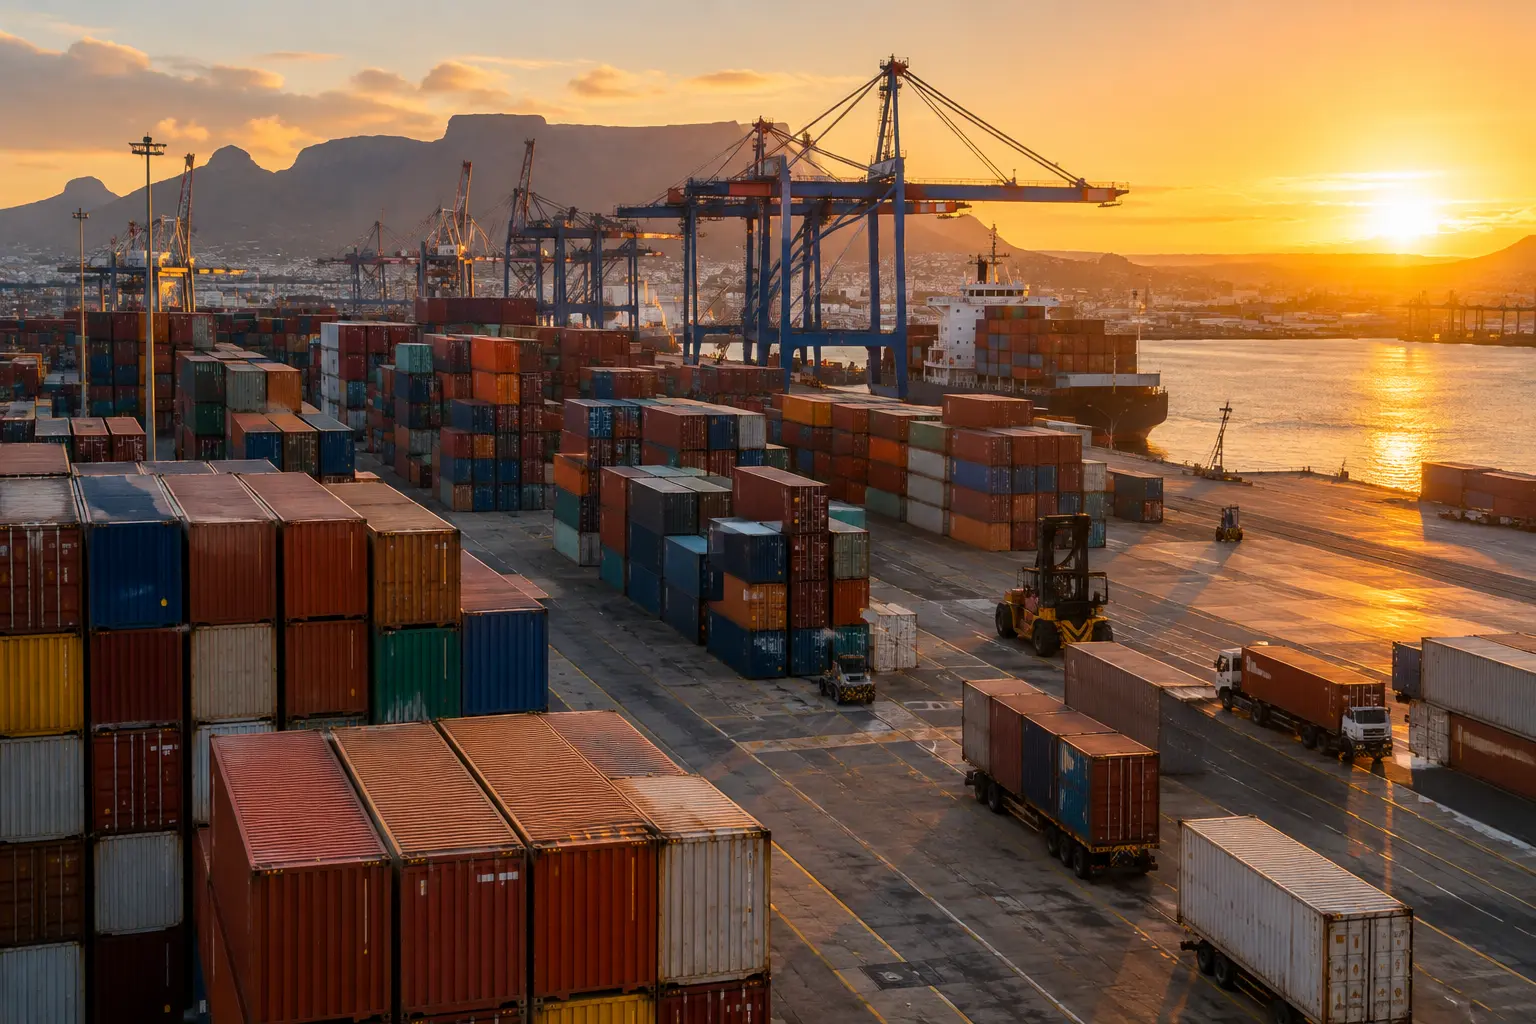
South Africa’s merchandise trade ran a surplus of R20.14 billion in July 2026 — exports of R193.97 billion against imports of R173.83 billion — according to SARS’s own trade statistics page, updated 31 August 2026. That single, dated, directly-citable figure illustrates the kind of data a supply chain dissertation can actually build on: a named source, a specific date, and a number read from the source itself rather than repeated from a secondary summary. The rest of this guide covers what South Africa’s other main freight and logistics bodies publish, and just as importantly, what they do not, so you can scope a data-collection chapter around what is genuinely accessible rather than what you assume should exist.
| Source | What it actually publishes | Update pattern | Best use in a dissertation |
|---|---|---|---|
| SARS trade statistics | Merchandise import/export values, trade balance, top trading-partner country shares, downloadable datasets and visualisations | Monthly overview figures; the July 2026 overview page was last updated 31 August 2026 | National-level trade volume and balance data, country-partner concentration analysis |
| Transnet | Annual Results (financial and operational reporting) across seven operating divisions | Annual, plus periodic operational statements | Freight rail, port and pipeline infrastructure context; corporate performance framing |
| Road Freight Association (RFA) | Industry association representing road freight operators; not a public statistics repository | Check its site for any current report before citing | Industry-body context and framing only — contact directly for member-level data |
What does SARS’s trade statistics page actually give you?
SARS describes itself as the legislatively empowered controlling entity for statistics on the importation and exportation of goods, and its trade statistics page covers the record-keeping, verification, publication and analysis of that merchandise trade data. On the page last updated 31 August 2026, the overview reported total exports of R193.97 billion and total imports of R173.83 billion for July 2026, a trade surplus of R20.14 billion, plus a breakdown of the top five trading-partner countries by percentage share for both imports and exports — China led on both sides, at 12.3% of exports and 23.7% of imports that month. Beyond the overview, the site offers an interactive visualisation tool, downloadable raw datasets, and detailed reports and press releases — genuinely usable primary sources, provided you always cite the specific month’s figures and the date you accessed them, since the numbers update regularly.
What about customs clearance and bill of lading data specifically?
SARS’s trade statistics are compiled from customs declaration data at the border, organised by Harmonized System (HS) commodity code rather than by individual shipment or bill of lading — meaning a dissertation can extract commodity-level import and export values and trends, but not shipment-level logistics detail such as carrier, vessel or specific transit time. For shipment-level detail (which carrier, which route, how long a specific consignment took), a dissertation typically needs primary data from a participating freight forwarder, shipping line or importer/exporter directly, since this level of detail is not part of SARS’s public statistical release.
What does Transnet actually publish?
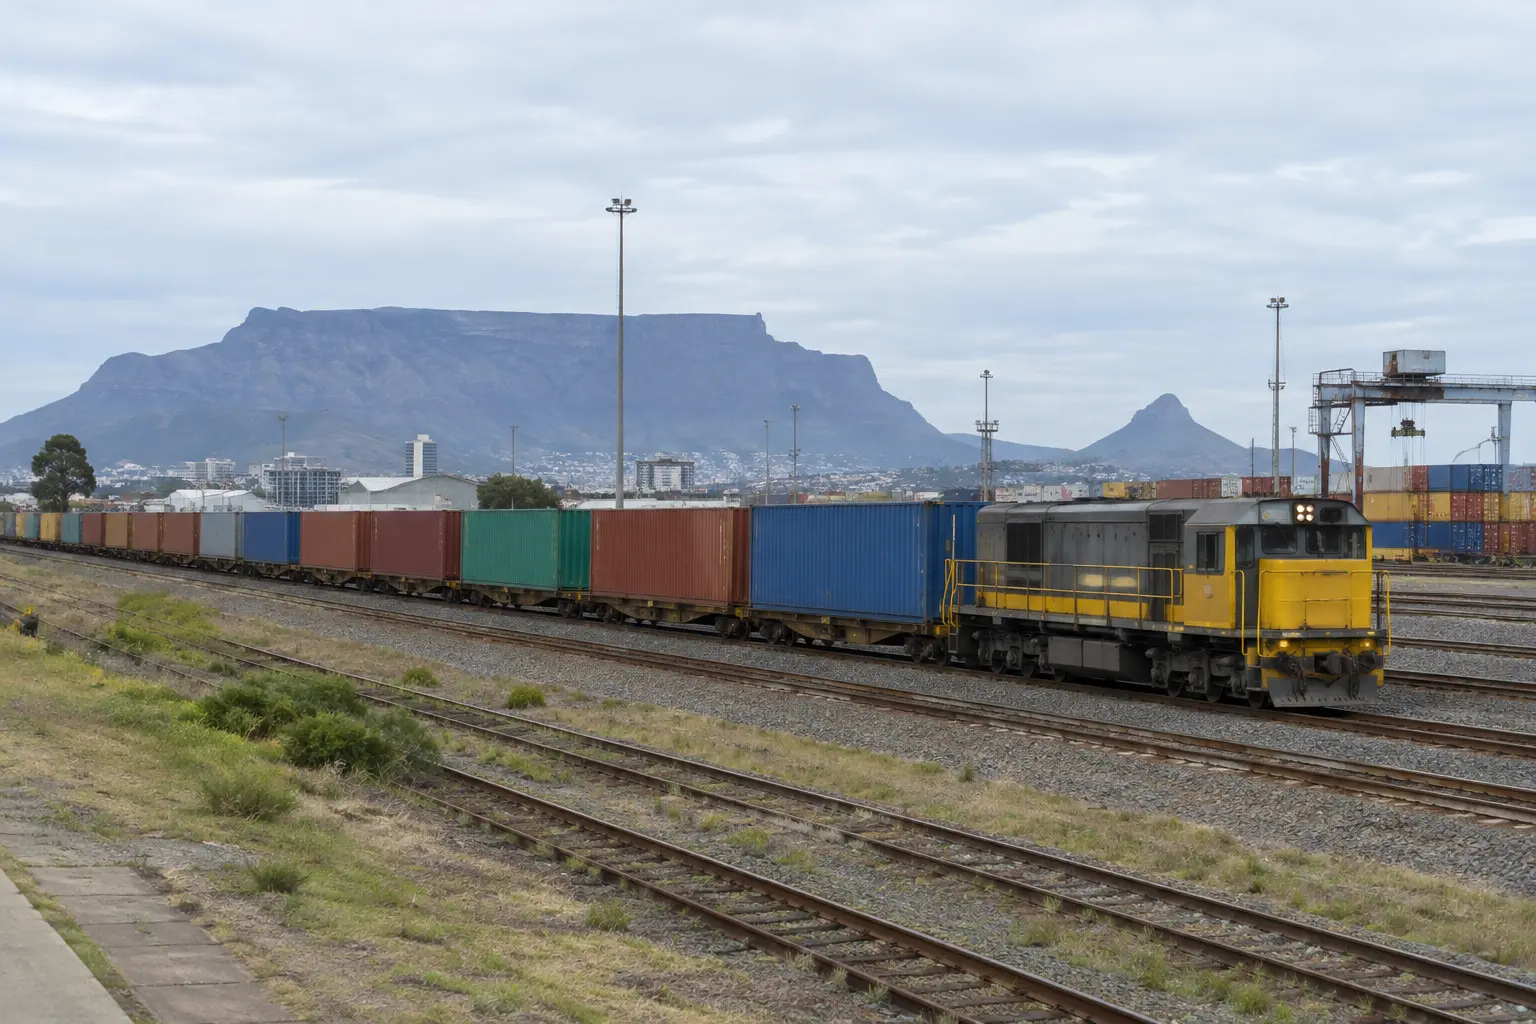
Transnet, South Africa’s state-owned freight logistics company, describes itself as “the largest and most crucial part of the freight logistics chain that delivers goods to each and every South African.” It operates across seven divisions: Transnet Engineering, Transnet Rail Infrastructure Manager (rail infrastructure), Transnet Freight Rail, Transnet Port Terminals, Transnet National Port Authority, Transnet Pipelines, and Transnet Property. Its site’s Annual Results section is the main public source of financial and operational reporting; specific throughput, tonnage or reliability statistics are not laid out as an open dataset on the main site, so a dissertation needing that level of detail should go to the specific division’s own published Annual Report rather than assuming a single homepage figure represents the whole freight system. The site also references its e-Tender procurement platform and periodic operational statements (such as capacity improvements at a specific container terminal) — useful as narrative context for a discussion of infrastructure investment, but again not a structured dataset.
What can the Road Freight Association tell my dissertation?
The Road Freight Association represents road freight operators in South Africa as an industry body. Treat it as a source to approach directly for industry context or a potential research contact, rather than as a citable data repository — do not assert a specific RFA-published figure without opening and reading the actual report yourself first, and cite that report, with its date, rather than the association’s general website.
How do the seven Transnet divisions map onto a supply chain dissertation’s scope?
Naming the right division matters because “Transnet” as a single word covers seven quite different operating businesses. A dissertation on port congestion or container handling sits with Transnet Port Terminals and the Transnet National Port Authority (which manages port infrastructure and vessel access separately from terminal operations). A study on rail freight capacity or the shift of cargo from road to rail sits with Transnet Freight Rail and Transnet Rail Infrastructure Manager, which split operating trains from managing the track network itself. A study on fuel or liquid bulk logistics sits with Transnet Pipelines. Naming the correct division in your problem statement, rather than referring to “Transnet” generically, signals to an examiner that you understand the organisation’s actual structure rather than treating it as a single undifferentiated entity.
A worked illustrative example

This example is entirely illustrative and fictional. A dissertation titled “The Effect of Port Congestion on Import Lead Times for South African Retailers” might use SARS trade statistics to establish the national import volume context and identify which trading partners contribute most to the commodity category studied, cite Transnet Port Terminals and the Transnet National Port Authority’s own Annual Results for the relevant port’s throughput and infrastructure investment context, and then collect primary data — lead-time records from two or three participating retailers or freight forwarders, obtained with their permission — to actually test the relationship the study is about. Neither national source supplies company-level lead-time data directly; they supply the macro context the primary data is then interpreted against.
What ethics and access considerations apply to company-level logistics data?
Lead-time, inventory or shipment-level data usually belongs to a private company, not a public body, so accessing it for a dissertation requires written gatekeeper permission from the company in addition to your faculty’s own research ethics clearance — and frequently a non-disclosure or data-use agreement specifying how the data may be reported, since a single company’s operational figures can be commercially sensitive. Where a company will only share data on condition of anonymisation (“a large retailer” rather than the company’s actual name), state this limitation explicitly in your methodology chapter rather than naming the company informally elsewhere in the text.
What other sources fill the gaps?
Where a dissertation needs broader economic or trade context beyond merchandise-goods statistics specifically, the site’s guide to getting South African data via Stats SA, SuperWEB2 and DataFirst covers the national statistics agency’s own broader economic series, which can complement SARS’s trade-specific figures. For a dissertation examining a specific company’s or sector’s data-source landscape more broadly, the site’s guide to data sources for an economics dissertation covers adjacent national datasets (SARB, National Treasury) that a supply chain study touching trade policy or exchange-rate effects may also need.
How do I avoid overstating what these sources say?
Trade statistics and freight-sector reporting both move monthly or annually, so a figure quoted without its specific reference period reads as more current, or more precise, than it actually is. Always state the exact month or reporting year alongside any SARS or Transnet figure, and never present an industry body’s general mandate description (what the RFA represents, what Transnet operates) as if it were a measured statistic. Where a source’s specific numbers are not publicly available — as can be the case with an industry association — say so plainly in your own methodology or limitations section rather than presenting an assumed figure as fact, and resist the temptation to fill the gap with a plausible-sounding estimate you have not actually verified.
Where do I go once I have the data?
Once your data sources are identified and their actual scope is clear, the next step is choosing the right statistical test or analysis approach for your specific research question — the site’s guide to choosing the right statistical test for a dissertation covers that decision in more depth.
Working out precisely what a national data source does and does not cover — and building a defensible citation around it — is exactly the kind of structuring work Tesify helps with, while the research and every word remain entirely yours.
Frequently asked questions
How often are SARS trade statistics updated?
The overview figures are updated on a rolling basis reflecting the most recent reporting month available; always note the specific “last updated” date shown on the page when you cite a figure, since it can move between your research and your final submission.
Can I download the underlying SARS trade dataset rather than just the overview figures?
Yes — the page links to downloadable datasets and an interactive visualisation tool in addition to the summary overview, useful if your analysis needs more disaggregation than the top-line monthly figures provide.
Does Transnet publish port-specific throughput statistics publicly?
Detailed, disaggregated throughput statistics are not presented as an open dataset on Transnet’s main public site; the Annual Results section and the relevant division’s own annual report are the more likely places to find this level of detail.
Is the Road Freight Association a government body?
No — it is an industry association representing road freight operators, distinct from a government department or state-owned entity like Transnet.
Can I combine SARS trade data with Transnet’s infrastructure reporting in one dissertation?
Yes — this is a common and defensible combination: national trade-flow data explains what is moving and where, while infrastructure reporting explains the capacity and constraints of the system moving it, and a supply chain dissertation often needs both halves of that picture.
Do I need permission to use SARS’s downloadable trade datasets in my dissertation?
Publicly published government statistics are generally citable in academic research with a standard reference and access date; check SARS’s own terms of use page for any specific conditions before large-scale reuse of downloaded data.
Can I study a single company’s supply chain without any national data at all?
Yes — a single-company case study built entirely on primary or company-provided data is a valid design, though most examiners still expect at least some national or sector-level context in the background chapter to justify why the case matters beyond that one organisation.
Is HS code (Harmonized System) classification relevant to a supply chain dissertation using SARS data?
Yes, if your study needs commodity-level detail rather than total trade values — SARS’s trade data is organised around HS codes, and understanding the relevant code structure for your specific product category is necessary to extract the right figures from the downloadable datasets rather than the topline totals only.
Should I convert SARS’s rand figures to US dollars for comparison with international literature?
This depends on your research question — if you are comparing against international benchmarks reported in dollars, state your exchange-rate source and the specific date used for the conversion explicitly, since a floating exchange rate makes any conversion time-sensitive.