
Most South African industrial psychology master’s dissertations are the same study underneath: a cross-sectional survey of employees in one organisation, two to four validated scales, and a model in which something like job resources predicts something like engagement, possibly through something like psychological capital. The analysis question is therefore not “which test” but “which of six analyses”, and the honest answer depends on your sample size, your software licence and how much your examiner trusts each method. The comparison first; the argument after.
The comparison at a glance
| Analysis | Question it answers | Typical sample | Software and cost in rand | Where it falls short |
|---|---|---|---|---|
| Correlation and hierarchical regression | Does X predict Y once biographical controls are in? | 120 to 300 | SPSS through the university licence; jamovi or JASP free | Cannot test a mediator; treats scale scores as error-free |
| Mediation and moderation with PROCESS | Does X work through M? Does the effect depend on W? | 150 to 300 | Free macro for SPSS or R from Andrew Hayes’s site | One model at a time, observed scores only, no fit indices |
| Confirmatory factor analysis and covariance-based SEM | Does the whole measurement-plus-structural model fit the data? | 200 or more, ideally 300 | AMOS where your SPSS licence includes it; lavaan in R free; Mplus paid in dollars | Needs a larger sample and near-normal data; a poorly fitting model is a chapter to itself |
| PLS-SEM | How much variance in Y does the model predict, with smaller samples? | 100 to 200 | SmartPLS sells student licences priced in euros; check the current rate | Examiners are divided; reporting conventions differ from covariance SEM |
| t-tests, ANOVA and MANOVA | Do biographical groups differ on the constructs? | Any, with 30 or more per group | SPSS or jamovi | A secondary objective, never the model |
| Measurement invariance and item bias | Does each scale work the same across language or race groups? | 100 or more per group | Multi-group CFA in AMOS or lavaan | A prerequisite to comparing groups, rarely a research question in itself |
Two things every row shares. Each starts with a psychometric step on your own data, and each ends in a results chapter your examiner must be able to follow without your syntax file. Both are covered below.
The ranked shortlist
1. Hierarchical regression with PROCESS for the mediator
Who it suits: the coursework master’s student with a sample of 150 to 300, one predictor, one mediator, one outcome and a supervisor who works in SPSS. You run reliability and a confirmatory factor analysis per scale, then correlations, then a regression that enters age, tenure and job level in step one and the predictor in step two, then PROCESS model 4 for the indirect effect with bootstrapped confidence intervals. Every result has an accepted write-up and every South African faculty has examined it many times.
Where it falls short: it treats each scale score as if it were measured without error, so the relationships you report are attenuated, and it cannot tell you whether your whole model fits. If your hypotheses include two mediators in sequence or a moderated mediation, PROCESS still handles it, but the write-up grows fast and the diagram belongs in an appendix.
2. Confirmatory factor analysis followed by structural equation modelling
Who it suits: the research master’s student with 250 or more respondents, a model with three or more latent variables and a department where AMOS or Mplus is already in use. The measurement model comes first, with the fit indices reported per scale and for the combined model; the structural model follows with standardised paths and the indirect effect bootstrapped. South African industrial psychology has used this route for two decades, and the field’s journal, the SA Journal of Industrial Psychology, is full of worked examples to model your tables on.
Where it falls short: sample size. A model with thirty items and four factors needs several hundred cases before the estimates settle, and a sample of 140 will produce a fit that examiners will not accept. Covariance-based SEM also assumes multivariate normality; Likert data with ceiling effects will need a robust estimator, which AMOS handles awkwardly and lavaan handles well. If the model does not fit, you owe the examiner a modification history, which is a chapter section, not a footnote.
3. PLS-SEM in SmartPLS
Who it suits: a student with a smaller sample, a model built for prediction rather than for testing theory, or constructs that are formative rather than reflective. PLS-SEM will estimate almost any model on 120 cases and produce a clean path diagram.
Where it falls short: your examiner. South African industrial psychology departments are divided on PLS-SEM; some accept it readily, others regard it as a way of avoiding the sample a covariance model would demand. Ask your supervisor, and if you use it, report by the PLS conventions: composite reliability, average variance extracted, the heterotrait-monotrait ratio for discriminant validity, and R-squared rather than chi-square-based fit. Mixing the two reporting vocabularies is the commonest PLS error in the dissertations we see.
4. Group comparison with t-tests, ANOVA or MANOVA
Who it suits: almost everyone, but only as the secondary objective. “Do engagement and turnover intention differ by tenure band or job level?” is answered with a MANOVA or a series of ANOVAs and belongs after the model, not in place of it.
Where it falls short: a dissertation that is only group differences is a descriptive study wearing inferential clothing, and industrial psychology examiners will say so. It also assumes the scale measures the same thing in each group, which brings us to the last row.
5. Measurement invariance across language and race groups
Who it suits: anyone comparing groups in a South African sample, which is most of you. The instruments the field uses were validated here on exactly this question. Storm and Rothmann’s 2003 analysis of the Utrecht Work Engagement Scale in the South African Police Service, on a stratified sample of 2 396 members across the nine provinces, confirmed the three factors of vigour, dedication and absorption and found no uniform or non-uniform item bias across race groups. Rothmann, Mostert and Strydom’s 2006 evaluation of the Job Demands-Resources Scale, on 2 717 employees, extracted five factors and reported acceptable equivalence across organisations for all but organisational support.
Where it falls short: it needs 100 or more per group to be meaningful, so a sample of 180 split three ways will not support it. If you cannot test invariance, say so in the limitations and do not over-read group differences.
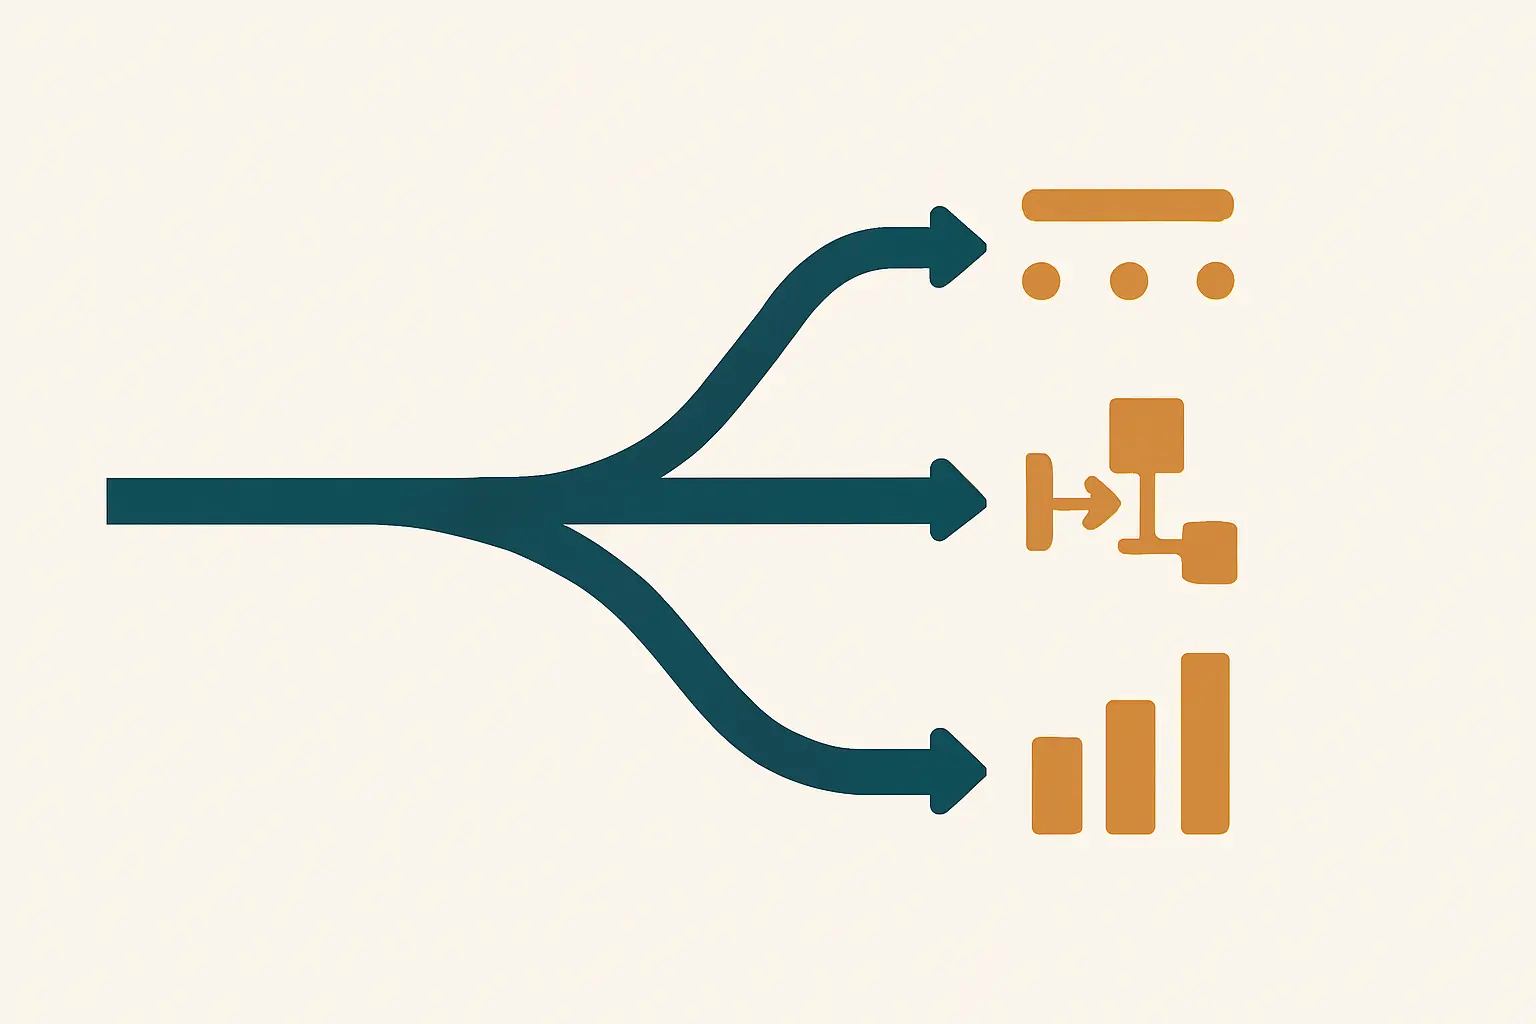
The step before any of them: the psychometrics of your own data
Whichever route you take, the results chapter opens with the same subsection: for each scale, Cronbach’s alpha or McDonald’s omega, a confirmatory factor analysis against the published structure, and the correlation matrix with means and standard deviations. South African validations exist for the scales the field leans on, and citing them is expected:
- Utrecht Work Engagement Scale: Storm and Rothmann (2003), SA Journal of Industrial Psychology, three factors, no item bias across race groups in a police sample.
- Job Demands-Resources Scale: Rothmann, Mostert and Strydom (2006), SA Journal of Industrial Psychology, five factors: overload, growth opportunities, organisational support, advancement and job insecurity.
- Psychological Capital Questionnaire, PCQ-24: Görgens-Ekermans and Herbert (2013), SA Journal of Industrial Psychology, internal and external validity on a South African sample, with relationships to stress, burnout and engagement.
- Turnover Intention Scale, TIS-6: Bothma and Roodt (2013), SA Journal of Human Resource Management, six items, alpha of 0,80 on a census sample of 2 429 ICT employees, and criterion validity against actual leaving at four months and four years.
If your published scale does not reproduce its factor structure on your sample, that is a finding, not a failure, and the argument for what to do next is set out in our answer to how to prove your questionnaire is valid. Add one check that industrial psychology examiners specifically look for in a single-source survey: a test for common-method bias, at minimum Harman’s single-factor test, reported with its limitation acknowledged.
The recommendation, stated plainly
For a coursework master’s with a sample under 250, run hierarchical regression and PROCESS, report the confirmatory factor analyses per scale, and state in the limitations that measurement error was not modelled. For a research master’s with 250 or more and a supervisor who uses AMOS or lavaan, run the two-step SEM. Use PLS-SEM only if your supervisor endorses it in writing before you collect data. Add group comparisons as a secondary objective, and test invariance first if your groups are large enough. No industrial psychology examiner has ever failed a dissertation for choosing regression over SEM when the sample justified it; several have sent back SEM on 130 cases.
The choice between the packages themselves, and which ones your library already pays for, is a separate decision worked through in our comparison of SPSS, R, jamovi and JASP for South African students. The short version for this field: SPSS with PROCESS costs you nothing if your registration is current, jamovi runs the same regressions and a lavaan-based SEM module for free, and AMOS is worth using only where it is already on the licence.
How the sample decides for you
The single number that settles most of this is how many usable responses you will actually get, which in a South African organisation is usually far fewer than the number of employees. A company of 900 that grants access will typically return 180 to 260 questionnaires after two reminders, and fewer where the workforce is not desk-based. Decide the analysis after estimating that figure honestly, not from the organisation’s headcount. The reasoning behind the estimate, and how to justify it to the ethics committee, is in our guide to how many participants a dissertation needs.

One consequence people miss: the model you pre-register in the proposal is the model you analyse. If the proposal promised SEM and the field returned 140 cases, write to the supervisor before the analysis, agree the regression route, and record the change in the methodology chapter. Examiners accept a documented change; they do not accept a silent one.
Writing it up so the examiner can follow
Whichever route, the results chapter follows the same order: sample description, psychometrics, descriptive statistics and correlations, hypothesis tests in the order of the hypotheses, then the model. Each hypothesis gets a sentence that names the statistic, the effect size and the decision, and the table carries the numbers. How to turn raw output into those tables and sentences, with the rounding and reporting conventions faculties expect, is covered in our guide to turning SPSS output into a results chapter.
Two field-specific habits. First, report standardised coefficients for paths and unstandardised ones for the indirect effect with its bootstrap interval, and say which is which. Second, every hypothesis you test must trace back to a named theory in the framework chapter; a mediator that appears in the analysis without appearing in the theory is the first thing an external examiner circles. If that chapter is not yet settled, our guide to choosing a theoretical framework for a psychology dissertation covers the theories the field cites, including the job demands-resources model most of these studies rest on.
Drafting the analysis chapter in the week the output arrives
An industrial psychology results chapter is repetitive by design: the same reliability paragraph four times, the same hypothesis sentence eight times, a table for each. That repetition is what Tesify handles well. You paste the output for each scale and each hypothesis, and it drafts the subsection in your faculty’s order and reporting style, so your evenings go to interpreting the mediation result rather than formatting the fourth alpha paragraph. Before submission, its similarity check runs your chapters against the literature you leaned on, so a validation paragraph that drifted too close to Storm and Rothmann’s wording is caught by you rather than by Turnitin at the faculty. There is a free plan.
Draft your industrial psychology results chapter with Tesify
Frequently asked questions
Is SEM required for an industrial psychology master’s dissertation in South Africa?
No. It is common in research master’s dissertations with large samples, but hierarchical regression with a PROCESS mediation is accepted at every South African department and is the better choice under about 250 respondents.
What sample size does SEM need?
Working rules put the floor at 200 for a modest model, with 300 or more for models with several latent variables and many items. Below that, estimates are unstable and fit indices unreliable, and examiners know it.
Is PROCESS free and does my faculty accept it?
The PROCESS macro is a free download from Andrew Hayes’s site and runs inside SPSS or R. It is widely accepted for mediation and moderation; cite the accompanying book and report the bootstrap confidence interval for the indirect effect.
Can I use PLS-SEM instead of AMOS?
Only with your supervisor’s agreement. Departments differ, and PLS-SEM has its own reporting conventions that must not be mixed with covariance-based fit indices.
Do I have to test measurement invariance?
If you compare language or race groups on a scale, yes, provided each group has roughly 100 or more cases. If your groups are smaller, state the limitation and interpret group differences cautiously.
Which scales already have South African validation studies?
The Utrecht Work Engagement Scale, the Job Demands-Resources Scale and the PCQ-24 all have validation papers in the SA Journal of Industrial Psychology, and the six-item Turnover Intention Scale has one in the SA Journal of Human Resource Management. Cite them in your instrument section.
Which software will I actually be able to afford?
SPSS and often AMOS come through your university licence while you are registered; jamovi, JASP, R and lavaan are free; PROCESS is free; SmartPLS charges for a student licence. Check your library’s software page before buying anything.