
Running a content analysis for a communication studies dissertation means systematically counting and categorising features of media text — words, images, sources quoted, tone — against a codebook built before coding starts, then checking that a second coder applies it consistently. Done properly, it turns a stack of newspaper articles, broadcasts or social media posts into a defensible, quantifiable answer to a specific research question.
Step 1: Write a research question a count can actually answer
Content analysis answers questions about pattern and frequency — how often, how much, in what proportion — not questions about lived experience or meaning-making, which belong to a qualitative design instead. A workable question names the media type, the feature being counted, and the comparison: “how does source diversity in coverage of a major national protest differ between two named South African news outlets over a defined period?” is workable; “how is the protest represented in the media?” is not yet specific enough to code against.
Step 2: Define the population and draw the sample
The population is every unit of media text that could answer the question — every article on a topic in a named outlet over a period, every broadcast bulletin, every post using a defined hashtag. Define the sampling frame precisely (which outlets, which date range, which section or programme) before sampling, then decide whether to code the full population (feasible for a narrow, short period) or draw a systematic or stratified sample (needed once the population runs into hundreds of units). State the exclusion criteria too — wire-service reprints, letters to the editor, or opinion pieces are often excluded from a study of straight news coverage, and the dissertation should say so explicitly.
Step 3: Choose your unit of analysis
Decide what one “unit” is before coding begins: a whole article, a single paragraph, a sentence, an image, or a single mention of an actor. Mixing units without saying so is a common, examiner-visible error — a study that sometimes counts a whole article and sometimes counts a single quote within it produces frequencies that cannot be compared to each other.
Step 4: Build the codebook
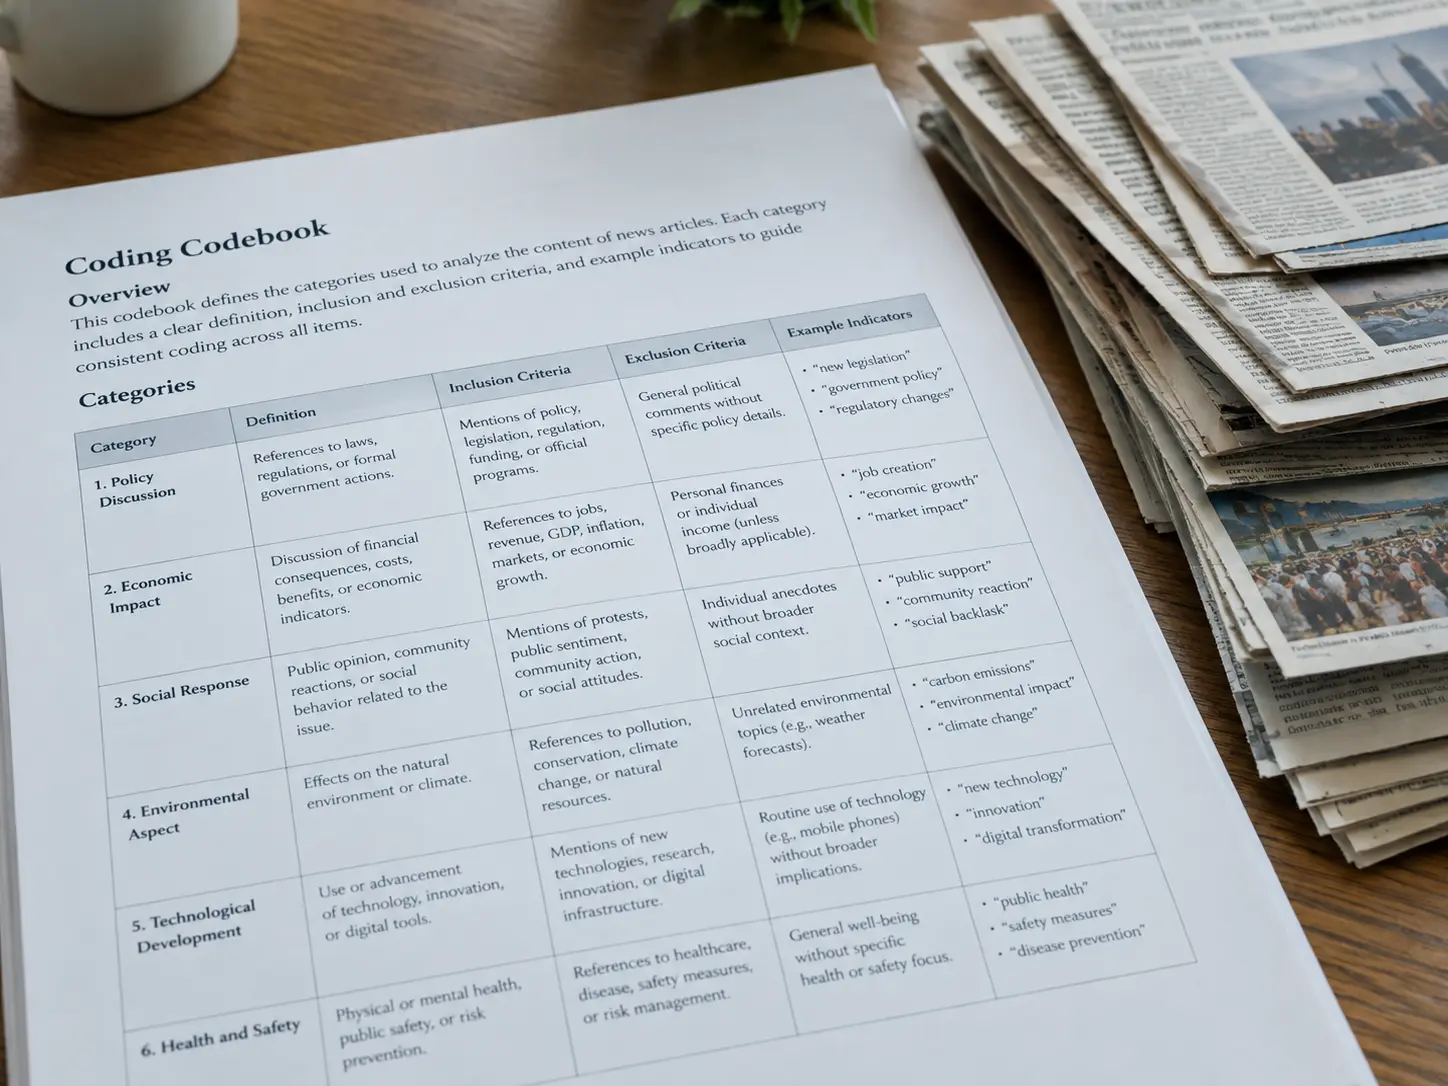
The codebook lists every category to be coded, with a precise definition and, where useful, an example of text that would and would not qualify. Categories typically fall into a small number of types for a communication studies content analysis: manifest categories (directly observable — word counts, source type, image presence) and latent categories (require more interpretation — tone, framing, emphasis). Latent categories need a tighter written definition and worked examples in the codebook precisely because they are more open to disagreement between coders. A codebook entry for “source type”, for example, should list the exact sub-categories (government official, opposition politician, ordinary citizen, expert/academic, anonymous source) rather than leaving “source” as a single undefined category.
Step 5: Pilot the codebook and check intercoder reliability
Before coding the full sample, two coders should independently code a subset (commonly 10–20% of the sample) using the draft codebook, then compare results. Disagreements are resolved by refining category definitions, not by one coder simply overruling the other — a codebook that produces disagreement is not yet finished. Reliability is then reported using an agreement statistic; Cohen’s kappa (for two coders) or Krippendorff’s alpha (which handles more than two coders and missing data) are the two most commonly reported in communication research, and a coefficient below around 0.70 is generally considered too low to proceed without revising the codebook further. Report the actual coefficient achieved, on the actual pilot sample, rather than citing a general rule of thumb as if it were your own result.
Step 6: Code the full sample
Once the codebook is stable and intercoder reliability is acceptable on the pilot, code the remaining sample, ideally with periodic reliability spot-checks throughout a long coding process rather than only at the start — coder drift, where a coder’s application of a category shifts gradually over weeks of coding, is a real and under-reported risk in student content analyses.
Step 7: Analyse the coded data
Most communication studies content analyses report descriptive statistics first — frequencies and percentages for each category, often broken down by outlet, time period or source type — before moving to inferential tests such as chi-square to test whether a difference between two outlets or two time periods is statistically significant rather than a chance pattern in a small sample. Present frequencies in tables, not only in prose, so a reader can check the underlying numbers.
Step 8: Interpret the pattern against theory
Numbers alone are not a discussion chapter. Tie the frequency pattern back to a communication theory relevant to the question — framing theory, agenda-setting, gatekeeping theory, or a specific media-representation framework — and explain what the pattern means for that theory, not just that it exists. A finding that one outlet quotes government sources twice as often as opposition sources is a number; connecting it to gatekeeping or framing theory, and to the South African media-ownership or editorial-policy context that plausibly explains it, is the interpretation an examiner is looking for.
A fully worked example

This example is entirely illustrative and fictional — invented to demonstrate structure, not a real study’s findings; every number below is made up for the demonstration.
Research question: How does source diversity in coverage of a national service-delivery protest differ between two named South African news outlets over a four-week period?
Population and sample: all news articles (excluding opinion pieces and letters) mentioning the protest in the two outlets’ online editions over the four weeks, N=142 articles, coded in full given the manageable population size.
Unit of analysis: the individual sourced quote or paraphrased statement within an article — one article can therefore contribute multiple coded units, giving 610 coded units in total (320 from Outlet A, 290 from Outlet B).
Codebook categories: source type (government official, protest organiser, ordinary resident, expert/academic, anonymous); tone of quote (neutral, sympathetic to protesters, critical of protesters); placement (headline/lead paragraph vs body).
Intercoder reliability: two coders independently coded 15% of the sample; Krippendorff’s alpha = 0.81 across the three categories, above the 0.70 threshold, so the full sample was coded by a single trained coder from that point.
Illustrative result: Outlet A quoted government officials in 45.9% of coded units (147 of 320) versus 31.0% for Outlet B (90 of 290); ordinary residents appeared as sources in 14.1% of Outlet A’s units (45 of 320) versus 26.9% of Outlet B’s (78 of 290), a difference tested for significance with a chi-square test (χ²(1)=15.57, p<0.001).
Interpretation: the pattern is discussed against gatekeeping theory and, where relevant, each outlet’s own stated editorial policy or ownership structure, rather than left as a bare percentage comparison.
How is this different from thematic analysis?
Content analysis and thematic analysis both work through a coding process, but they answer different kinds of questions. The site’s guide to thematic analysis, step by step is built for qualitative, meaning-focused questions — how participants or texts make sense of an experience — with codes that can evolve inductively as analysis proceeds. Content analysis, particularly the quantitative form described above, fixes its categories before large-scale coding begins and reports its results as frequencies and statistical comparisons. A communication studies dissertation can use either, or both in a mixed-methods design, but the two should not be described interchangeably in a methodology chapter — examiners specifically check that the label matches the actual coding process used.
What software should I use to code?
For a purely quantitative content analysis, a well-structured spreadsheet is often sufficient for coding and produces frequencies a statistics package can then test. For a mixed or more qualitative content analysis with longer text segments and more latent categories, qualitative data analysis software makes the coding and reliability-checking process considerably faster — see the site’s comparison of NVivo, ATLAS.ti, MAXQDA and Taguette for South African postgraduates. NVivo, ATLAS.ti and MAXQDA each include a built-in intercoder agreement feature; Taguette, the free option, does not advertise one, so with Taguette the agreement statistic is calculated separately from exported codes.
Do I need ethics clearance to analyse published media content?
Published media content is public and does not involve human participants in the way an interview or survey does, but most South African faculties still require a light-touch ethics application or exemption confirmation for any research project, including desk-based content analysis — check with your own department’s ethics clearance process rather than assuming a desk-based study is automatically exempt.
What mistakes make examiners send a content-analysis chapter back?
Four recur most often. First, a codebook built after coding has already started, adjusted on the fly as the coder encounters unexpected content — this defeats the purpose of a fixed, testable coding frame and should be avoided by piloting properly in step 5. Second, reporting frequencies without ever stating the total number of units they are a percentage of, making the numbers impossible to check. Third, treating a single coder’s results as if reliability were established, with no intercoder check reported at all. Fourth, a discussion chapter that restates the frequency table in prose without connecting it to the communication theory named in Chapter 2 — the numbers need an explanation, not just a repetition.
Building a codebook this precisely, and keeping the reliability checks an examiner expects to see, is exactly the kind of structuring work Tesify helps with — the categories you define and the interpretation you write stay entirely your own.
Frequently asked questions
How many articles or units do I need for a credible content analysis?
There is no single national figure — it depends on the population size and how narrow the time period and outlets are. A manageable population (a few hundred units over a defined period) can often be coded in full; a larger population needs a systematic or stratified sample large enough to support the statistical test planned in step 7.
Can I code social media posts instead of news articles?
Yes — the same steps apply, though defining the sampling frame is harder (which hashtag, which platform, which date range, and how to handle reposts or duplicate content) and should be described in more detail in the methodology chapter than for a fixed set of news outlets.
What if my two coders never reach acceptable reliability?
Revise the codebook’s category definitions rather than abandoning the categories — vague or overlapping definitions are the most common cause of low intercoder reliability, and a clearer definition with better worked examples usually resolves it within one or two more pilot rounds.
Can I be my own second coder?
Some programmes accept a supervisor or a peer as the second coder where resources are limited, but check your department’s requirements — an entirely single-coder study without any reliability check is a common examiner criticism of student content analyses.
Is content analysis considered a quantitative or qualitative method?
It can be either. Quantitative content analysis (the form emphasised in the steps above) reports frequencies and statistical tests. Qualitative content analysis uses a similar coding logic but reports patterns descriptively rather than statistically — state clearly in the methodology chapter which version your study uses.
Do I need to translate non-English source material before coding?
If your sample includes South African media in isiZulu, Afrikaans or another official language, decide and state upfront whether coding happens in the original language (requiring a coder fluent in it) or on a translated version, and note this as a methodological choice with implications for nuance, particularly for latent categories like tone.
How is content analysis different from a systematic literature review?
A systematic review synthesises existing academic studies on a topic. A content analysis codes primary media or text data you collect yourself. They can share some procedural similarities (a defined search or sampling protocol, coding categories) but answer entirely different kinds of research questions.