
It is late, you finally ran the analysis, and Shapiro-Wilk came back significant on your main outcome variable. The t-test you have been planning for eight months appears to be dead, your data collection is finished and unrepeatable, and your submission date has not moved. Read the next paragraph before you do anything drastic: in most dissertations this is a twenty-minute problem that students turn into a three-week one.
Keep your chapter moving tonight — start your project in Tesify →
What the panic actually costs
Nothing about a failed normality check is fatal. What is expensive is what students do next: stop writing entirely for a fortnight, wait three weeks for a supervisor to answer a question this page answers, or quietly run the parametric test anyway and hope no examiner checks. The first two burn calendar you do not have; the third puts a defect into a document that will be assessed by independent external examiners who read analysis sections for a living. And the calendar matters in rand: a dissertation that misses its submission window is another year of registration fees, possibly a lapsed bursary, and — as the national cohort data in our throughput statistics guide shows — more than one in three coursework master’s students who started in 2018 had dropped out by 2023. Attrition at this level is rarely about ability. It is about momentum lost at exactly this kind of moment.
First: check five things before you change anything
Most “failed” normality checks are not the problem the student thinks they are.
- Check what the assumption actually applies to. For a t-test or ANOVA, normality is an assumption about the distribution within each group — or, more precisely, about the residuals — not about your outcome variable pooled across the whole sample. A bimodal-looking overall distribution is completely expected when two groups genuinely differ. Students routinely test the wrong thing and conclude the wrong thing.
- Check your sample size, because the test is distorted by it. Significance tests of normality are sensitive to N in a way that makes them treacherous. With a large sample, a departure far too small to matter will return a significant result. With a small sample, the test lacks the power to detect a departure that does matter. A p value from Shapiro-Wilk is therefore weak evidence on its own — which is why it should never be your only check.
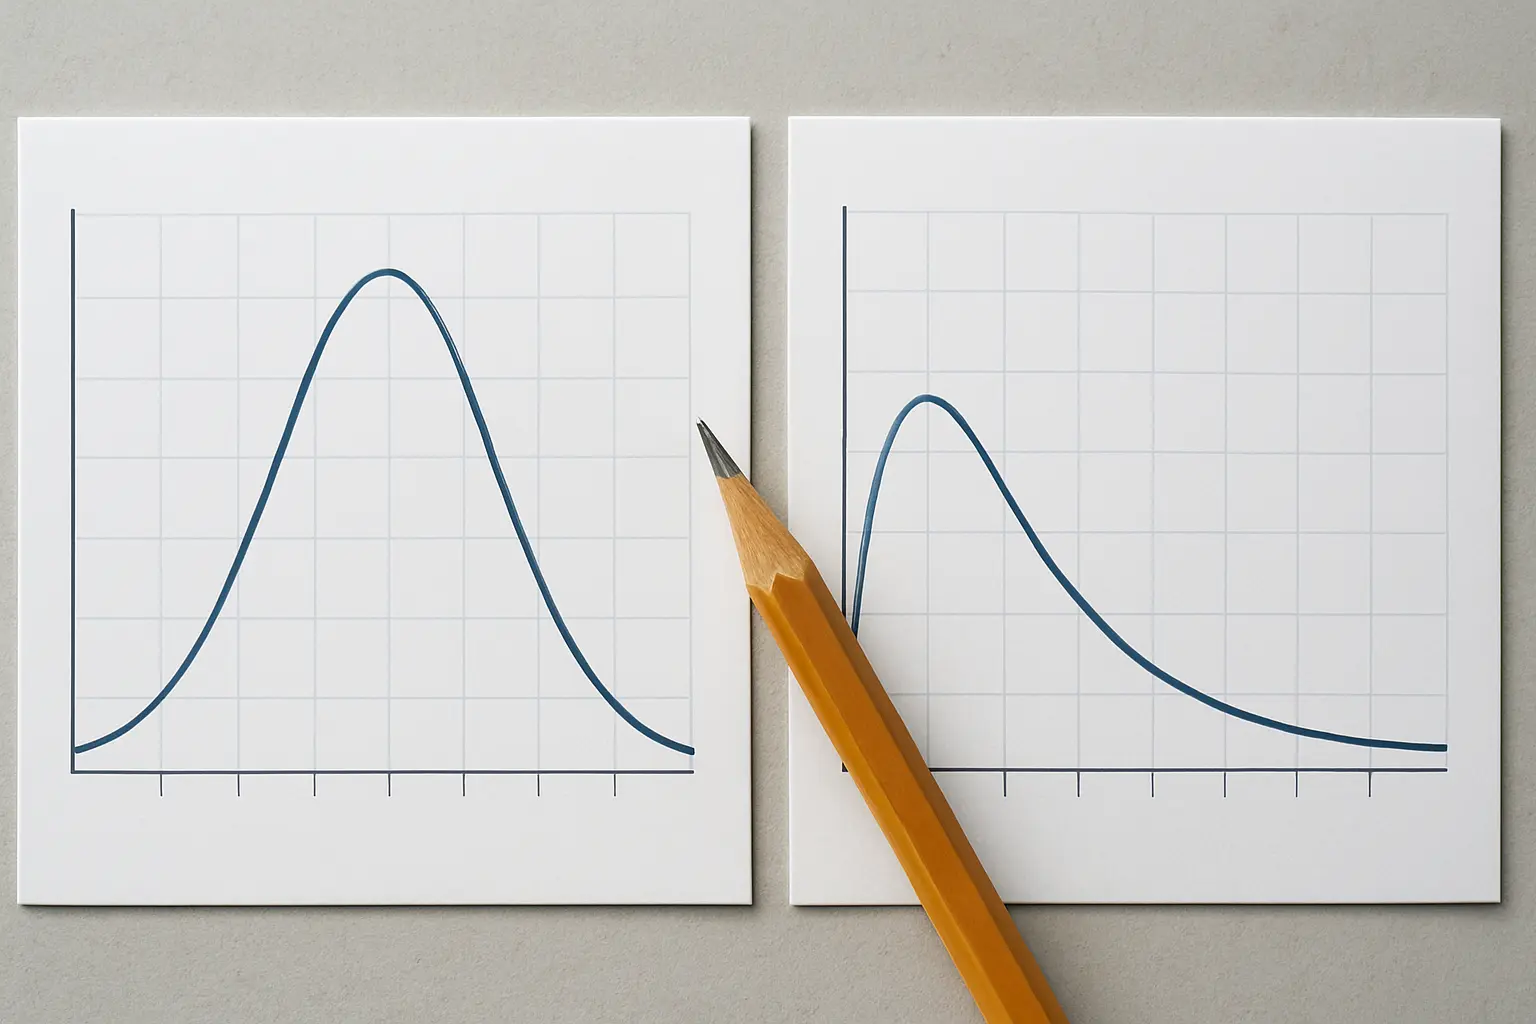
- Look at the actual shape. Plot a histogram and a Q-Q plot. Eyes beat p values here. Mild skew that hugs the diagonal on a Q-Q plot is a different situation from a hard floor effect where half your participants scored the minimum, and the two call for different responses.
- Look for outliers and data errors. A single impossible value from a capture error can wreck a distribution on its own. Go back and check it against the original questionnaire. Correcting a genuine capture mistake is data cleaning; deleting a real observation because it is inconvenient is not, and the difference must be documented either way.
- Remember the central limit theorem. For reasonably sized samples, the tests that compare means are considerably more robust to non-normality than their reputation suggests, because what matters is the sampling distribution of the mean rather than the raw data. This is why “the data was not perfectly normal” alone is not a reason to abandon a planned analysis.
Working through those five honestly resolves a large share of cases: nothing needs to change, and you write one sentence explaining why. That sentence is worth more marks than switching tests would have been.
The four legitimate routes forward
If the departure is real and consequential, you have four defensible options. Every one of them is a normal analytical decision. None of them is an admission of failure.
Route 1: Use the non-parametric equivalent
The simplest and most common route. Each parametric test has a distribution-free partner: the Mann-Whitney U test for the independent-samples t-test, the Wilcoxon signed-rank test for the paired t-test, Kruskal-Wallis for one-way ANOVA, Friedman for repeated measures, Spearman for Pearson. The full mapping is in our guide to choosing a statistical test. You are trading a small amount of statistical power for freedom from the distributional assumption, and you must remember that these tests answer a slightly different question — about ranks and distributions rather than means — so your reporting language changes with them.
Route 2: Transform the variable
A logarithmic, square-root or reciprocal transformation can pull a skewed variable towards symmetry, and this is standard practice for the naturally right-skewed variables common in South African research — income, expenditure, waiting times, counts of events. The cost is interpretability: your results are now about log-income, not income, and your discussion chapter must translate back into language a reader understands. Report the transformation, why you chose it, and check that it worked rather than assuming it did.
Route 3: Use a robust or resampling method
Bootstrapping estimates confidence intervals by resampling your own data rather than relying on a theoretical distribution, and it is available in SPSS for many common procedures. It lets you keep a mean-based analysis and its interpretability while relaxing the distributional assumption. It is the most sophisticated of the four routes and the one most worth asking a departmental statistician about before committing.
Route 4: Change the model to fit the data
Sometimes the distribution is telling you that your outcome is not really continuous. Heavy clustering at zero, or a variable that is genuinely a count, or an outcome most people simply passed or failed, points towards a different model family altogether rather than a repair to the one you planned. This is the biggest change of the four and the one to discuss with your supervisor, but when it applies it produces a better dissertation than forcing the original plan through.
How to write the decision up so an examiner nods
Whichever route you take, the write-up follows the same four-part shape, and it belongs in your methodology or results chapter:
- What you checked and how. “Normality of the outcome within each group was assessed using Shapiro-Wilk together with visual inspection of histograms and Q-Q plots.”
- What you found. “Scores were significantly non-normal in both groups, with pronounced positive skew.”
- What you did and why. “The Mann-Whitney U test was therefore used in place of the planned independent-samples t-test.”
- What it means for interpretation. One sentence acknowledging what changed about the claim you can make.
Four sentences. That is the entire deliverable, and it converts what felt like a catastrophe at midnight into evidence that you understood your own analysis. Examiners are not looking for perfectly normal data — real data is rarely normal. They are looking for a candidate who checked, noticed and responded. In South Africa that matters twice over, because your dissertation is examined in writing without you in the room: there is no viva in which to explain a decision you left off the page.

Where Tesify fits into tonight
The analytical judgement here is yours and must stay yours. What you can hand off is the part that actually eats the fortnight — the writing, the structure and the record-keeping around the decision. Concretely, in one evening:
- Open your project and go to the methodology chapter where the analysis plan already sits, so you are editing a document rather than facing a blank page at 22:30.
- Draft the four-part assumption paragraph above in your own words, and use Tesify to tighten it and check that it reads as a decision rather than an apology.
- Update the results chapter plan so the tables you now need are listed before you generate them, rather than being discovered missing in submission week.
- Log the change — what you checked, what you found, what you switched to — so the paragraph exists while the reasoning is fresh and you are not reconstructing it eighteen months later from an output file.
You can start on the free tier and see whether the workflow fits before paying anything. The thing that matters is that tonight ends with a paragraph written instead of a fortnight lost — and if the deeper problem is that your evenings are two hours long and already full, our system for writing a dissertation around a full-time job is the other half of the answer.
Start your project and write the paragraph tonight →
Objections, answered honestly
What does Tesify cost in rand?
Current pricing is shown on the Tesify site at sign-up, charged in your card currency. Start free and see the plans before paying anything — and treat any third-party page quoting a rand figure as potentially out of date, including this one, which is why we do not print a number.
Does using it breach my university’s plagiarism policy?
Writing your own methodology paragraph with editing support is not what integrity policies target; submitting text you did not write is. South African universities regulate disclosure rather than banning assistance, and our guide to AI policies at South African universities sets out what UCT, Wits, Stellenbosch and Unisa each require. Declare your use and tell your supervisor.
What happens to my data?
Your project is your own work and stays yours. Read the privacy policy at sign-up, as you should for any tool that touches unpublished research — and keep raw participant data out of every external tool unless your ethics clearance explicitly covers it. Your dataset does not need to go anywhere near a writing tool for any of this.
Can it decide which test I should run?
It can explain the options and help you write the justification; it should not make the call for you. Anything you cannot defend in one sentence does not belong in your dissertation, and the four-part paragraph above is the standard to hold yourself to.
FAQ
What does a significant Shapiro-Wilk result mean?
That the departure from normality in your sample is larger than chance would comfortably explain. It does not tell you whether the departure is large enough to affect your analysis, which is why it must be read alongside a histogram, a Q-Q plot and your sample size.
Can I still run a t-test if my data is not normal?
Often, yes — tests comparing means are reasonably robust to non-normality at moderate sample sizes. What is not acceptable is running it without checking, or checking and not reporting. Look at the severity of the departure, decide, and write down the reason.
Should I use Shapiro-Wilk or Kolmogorov-Smirnov?
Shapiro-Wilk is generally the more powerful of the two and is the one most commonly reported in dissertations. SPSS produces both; report the one you relied on and support it with the plots.
Is it acceptable to delete outliers to achieve normality?
Only where the value is a demonstrable error, and always with the deletion and its reason reported. Removing genuine observations because they are inconvenient changes your findings and is not defensible.
Do non-parametric tests test the same hypothesis?
Not exactly. They ask about ranks and distributions rather than means, so your wording must change with them — “scores were significantly higher” rather than “the mean was significantly higher”.
Does normality matter for correlation and regression?
Differently. For regression the assumption concerns the residuals rather than the raw variables, so run your diagnostics on the fitted model rather than on the inputs. Testing the wrong thing is the most common error here.
My sample is small. Does the test even work?
Its power is limited, so a non-significant result is weak reassurance. With small samples, lean on the plots and on what is theoretically plausible for your variable, and consider a distribution-free test as the conservative choice.
Do I have to report all of this in my dissertation?
Yes, briefly. Four sentences — what you checked, what you found, what you did, what it means — in your methodology or results chapter. Silence on assumptions is what draws examiner queries.