
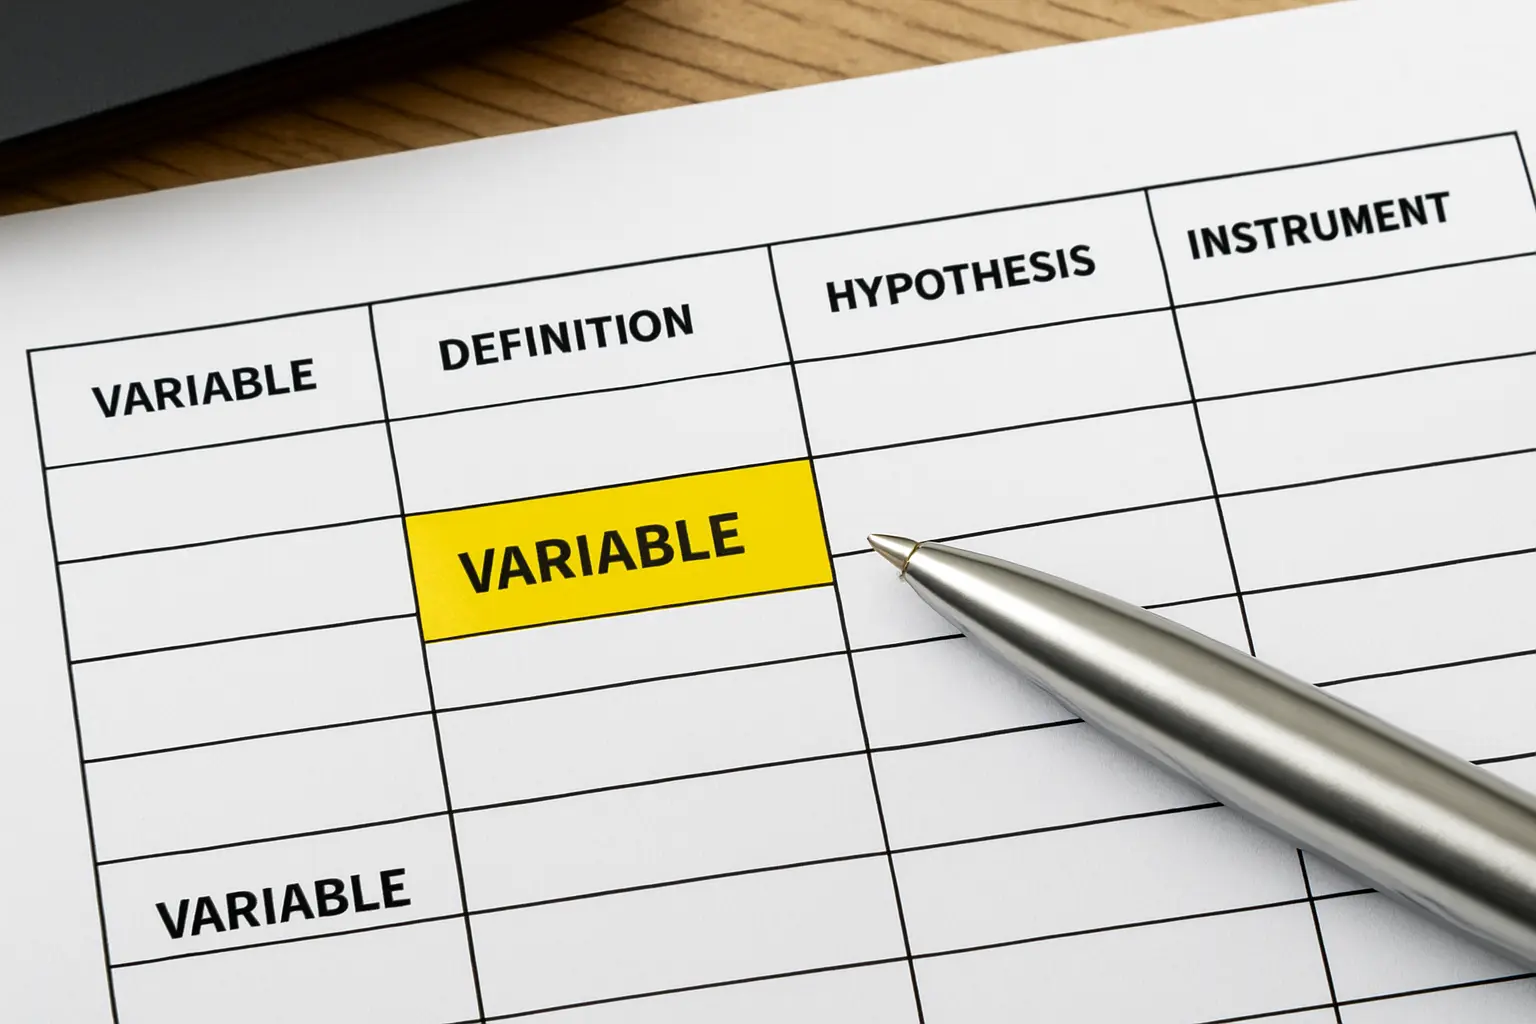
A variables and hypotheses matrix is a single table that lines up every variable in your study, its conceptual and operational definition, the hypothesis that connects it to your other variables, and the instrument or item that will measure it. Examiners use it to check consistency at a glance: does every hypothesis actually have a matching variable, and does every variable actually have a matching item on your questionnaire? For a South African psychology dissertation, this table usually appears at the end of Chapter 1 or inside Chapter 3, and a missing row is an easy way to draw a revisions comment.
What columns does a psychology variables and hypotheses matrix need?
Five columns cover the core alignment: (1) the variable, labelled independent, dependent, mediating or moderating; (2) its conceptual definition, the theoretical meaning drawn from your framework; (3) its operational definition, how it is actually measured in this study; (4) the matching hypothesis, stated as a directional or non-directional relationship; and (5) the instrument or item number that produces the data. A sixth column, the expected statistical test, is worth adding because it forces the alignment between design and analysis to happen before data collection rather than after.
How do I build the matrix, step by step?
1. List every variable your research questions imply, including moderators and controls, before writing a single hypothesis — a variable that only appears later, inside a hypothesis, is the row most often forgotten. 2. Write the conceptual definition for each variable, attributed to the same theorist your framework chapter already names. 3. Decide the operational definition — the specific instrument, scale or item set — before you finalise your hypothesis wording, since the hypothesis has to be testable with what you actually measure. 4. Write each hypothesis using the exact variable labels from column one, not a paraphrase; “stress” and “perceived occupational stress” are not interchangeable once you have defined the second one operationally. 5. Add the instrument and item numbers, checked against your actual questionnaire draft, not an earlier version. 6. Add the expected statistical test last, and use it as a check: if a hypothesis needs an analysis your sample size or design cannot support, that is the moment to revise the hypothesis, not after data collection.
A worked example: a moderation design
The example below follows one illustrative topic: the relationship between image-based social media use and body image concern among South African university students, and whether social comparison orientation moderates this relationship. The values in the table are placeholders, not real findings — the point is the alignment between columns, which is what an examiner is actually checking.
| Variable | Conceptual definition | Operational definition | Hypothesis | Instrument / item |
|---|---|---|---|---|
| Image-based social media use (IV) | Frequency of engagement with photo- and video-centred platforms | Self-reported hours per day on Instagram/TikTok, measured on a 6-point frequency scale | H1: Higher image-based social media use is associated with greater body image concern | Researcher-adapted social media use items, items 1–4 |
| Body image concern (DV) | Negative cognitive and emotional evaluation of one’s physical appearance | Total score on a validated body-image scale (higher = greater concern) | See H1 | [named validated scale], items 1–10 |
| Social comparison orientation (moderator) | Dispositional tendency to compare oneself with others | Total score on a validated social comparison scale | H2: Social comparison orientation moderates the relationship between image-based social media use and body image concern, such that the relationship is stronger among high comparers | [named validated scale], items 1–11 |
| Age, gender (controls) | Demographic variation known to affect body image | Self-reported categorical items | Controlled for in regression models, not independently hypothesised | Demographic section, items 1–2 |
Reading this table by row is the examiner’s check: row one’s hypothesis needs row one’s instrument to actually exist on the questionnaire; row three’s moderation hypothesis needs a moderation analysis, not a simple correlation, in whatever methods chapter follows.
A worked example: a mediation design
Change the question and the table changes shape. Suppose the study instead asks whether appearance-based social comparison explains, rather than changes the strength of, the link between social media use and body image concern — a mediation design rather than a moderation one.
| Variable | Conceptual definition | Operational definition | Hypothesis | Instrument / item |
|---|---|---|---|---|
| Image-based social media use (IV) | Frequency of engagement with photo- and video-centred platforms | Self-reported hours per day, 6-point frequency scale | H1: Higher use predicts greater body image concern | Researcher-adapted social media use items, items 1–4 |
| Appearance comparison behaviour (mediator) | The act of comparing one’s own appearance to images viewed online | Total score on a validated appearance-comparison scale | H2: Social media use predicts appearance comparison behaviour, which in turn predicts body image concern (indirect effect) | [named validated scale], items 1–8 |
| Body image concern (DV) | Negative cognitive and emotional evaluation of one’s physical appearance | Total score on a validated body-image scale | See H2 | [named validated scale], items 1–10 |
The hypothesis wording changes from a moderation statement (“stronger among”) to an indirect-effect statement (“predicts, which in turn predicts”), and the expected test column changes from a moderated regression to a mediation analysis such as the PROCESS macro or structural equation modelling — the single word separating “moderates” from “mediates” in your hypothesis column should already tell you, and your supervisor, which analysis chapter you are committing to.

How do operational definitions differ from conceptual definitions in this matrix?
The conceptual definition is what the construct means theoretically — drawn from the theoretical framework chapter and usually attributed to a named author. The operational definition is what you actually did to turn that meaning into a number: which scale, which scoring rule, which cut-off. A common examiner comment is that the conceptual column reads well but the operational column is vague (“measured using a questionnaire” instead of naming the instrument and its scoring). Every row needs both, and they need to visibly describe the same thing at two levels of precision, not two different things.
What does a multilingual South African sample add to this table?
Where an instrument was validated in English but your sample includes first-language isiZulu, isiXhosa, Afrikaans or Sesotho speakers, the operational definition column needs to say so explicitly: which language version was administered, whether it was back-translated, and whether reliability was re-checked in the translated form. An operational definition that states “measured using the [scale]” without naming the language of administration leaves an examiner to assume the original validation sample and language apply unchanged — an assumption that frequently does not hold, and one your limitations section will need to address if it was not tested.
What is the difference between a matrix and the generic operationalisation table already on this site?
A single-discipline matrix like this one goes deeper than a one-row-per-field bank: it carries every variable in one study, including moderators, mediators and controls, matched to its own hypothesis and its own instrument in the same row. If you want to see how the same operational-definition logic looks across several disciplines at once, in a single row each, operationalisation of variables: table and examples for a South African dissertation covers that breadth; this page goes deep on one field and one design family instead.
What common mistakes sink a psychology matrix?
- A hypothesis with no matching variable row, or a variable with no matching hypothesis — the single fastest thing an examiner checks first.
- An operational definition that names no instrument at all (“measured using a survey”).
- A moderator variable analysed as if it were a second independent variable, with no interaction term specified, or a mediator tested with a simple correlation instead of an indirect-effect model.
- Directional hypotheses stated where the theoretical framework only supports a non-directional prediction.
- Demographic controls listed with a hypothesis attached, when they are typically statistical controls rather than tested relationships.
- Variable labels that drift between chapters — the matrix says “body image concern” but the results chapter reports “body dissatisfaction,” leaving the examiner to guess whether these are the same construct.
How does this matrix connect to the rest of the proposal?
The variable labels in this table should be traceable straight back to your theoretical framework’s named constructs, and straight forward into your choice of statistical test — a moderation hypothesis needs a moderation-capable analysis such as PROCESS, not a simple correlation, and a mediation hypothesis needs an indirect-effect test, not a regression coefficient read on its own. Worked research-aims and problem-statement examples that this matrix can sit underneath are in research aims and objectives: 30 examples for a South African dissertation. Building this table before you finalise your questionnaire, rather than after, is one of the places Tesify can save you a rewrite — draft the matrix alongside your chapters while you can still add a missing item.
Frequently asked questions
Does every psychology dissertation need a formal matrix table?
Not every faculty requires the table in this exact form, but every quantitative psychology dissertation needs the underlying alignment it represents. Ask your supervisor whether a formal table is expected or whether the alignment just needs to be demonstrable across chapters.
Where does this table usually go in the dissertation?
Most commonly at the end of Chapter 1 (after the hypotheses are stated) or inside Chapter 3 (alongside the instrument description). Some departments want it in both places.
What is the difference between a mediator and a moderator in this matrix?
A mediator explains the mechanism between two variables (X causes M which causes Y); a moderator changes the strength or direction of a relationship (X predicts Y more strongly when M is high). Each needs a different row and a different statistical test, as the two worked tables above show.
Can a qualitative study use a version of this matrix?
Not in this form — qualitative designs do not test hypotheses. A comparable table for a qualitative or mixed-methods study would map research questions to data sources and analytic approach instead.
What if my theoretical framework does not predict a direction?
State a non-directional hypothesis and say so explicitly in your framework chapter. Forcing a directional hypothesis your theory does not support is a more serious problem than stating an honest non-directional one.
How many hypotheses is too many for an honours or master’s study?
There is no fixed number, but each hypothesis adds a test, a required sample-size consideration and a discussion-chapter obligation. A small set of focused hypotheses is usually more defensible than many loosely related ones.
Should control variables have their own hypothesis?
Usually not. Controls are included to rule out alternative explanations statistically; they are not typically the subject of a directional prediction unless your framework specifically theorises their effect.
What happens if my pilot data does not support the operational definition I chose?
This is exactly what a pilot is for. Revise the operational definition or the instrument before full data collection, and document the change and the reason in your methodology chapter.
Does the matrix need to match the order variables appear in the questionnaire?
Not necessarily, but every item number cited in the matrix must correspond to a real item in the final questionnaire version submitted with the proposal. Mismatches here are a common, avoidable examiner query.
Can one instrument measure two different variables in the matrix?
Yes, if the instrument has separate validated subscales — each subscale then gets its own row, with its own conceptual definition and hypothesis, rather than one row covering the whole instrument.
Does the matrix need updating after data collection?
The matrix itself is a planning document and stays as submitted in the proposal; any deviation between planned and actual analysis (a different test used, an item dropped for poor reliability) belongs in the methodology chapter as a documented, explained change, not as a silent edit to the original matrix.