
| Analysis | Best for | Sample size need | Software | Verdict |
|---|---|---|---|---|
| Pearson/Spearman correlation | Testing whether two HR variables move together (e.g. engagement and turnover intention) | Modest (30+) | SPSS, R, jamovi | Good first step, not enough alone for a full HRM dissertation |
| Multiple regression | Testing whether several predictors (leadership style, pay satisfaction, workload) explain an outcome | Larger (rule of thumb: 10–15 cases per predictor) | SPSS, R | The default for most quantitative HRM dissertations |
| Mediation/moderation (PROCESS macro) | Testing an indirect mechanism (e.g. does engagement mediate the leadership–performance link?) | Larger still | SPSS with PROCESS add-on, R | Use when your framework proposes a mechanism, not just a direct link |
| ANOVA / t-test | Comparing group means (e.g. engagement by department or tenure band) | Depends on group sizes | SPSS, R, jamovi | Use for group-comparison research questions, not relationship questions |
| SEM / PLS-SEM | Testing a whole multi-variable model with several relationships at once | Larger, model-dependent | AMOS, SmartPLS, R (lavaan) | Reserve for master’s/PhD-level HRM studies with a complex proposed model |
Match the analysis to the research question, not the other way around
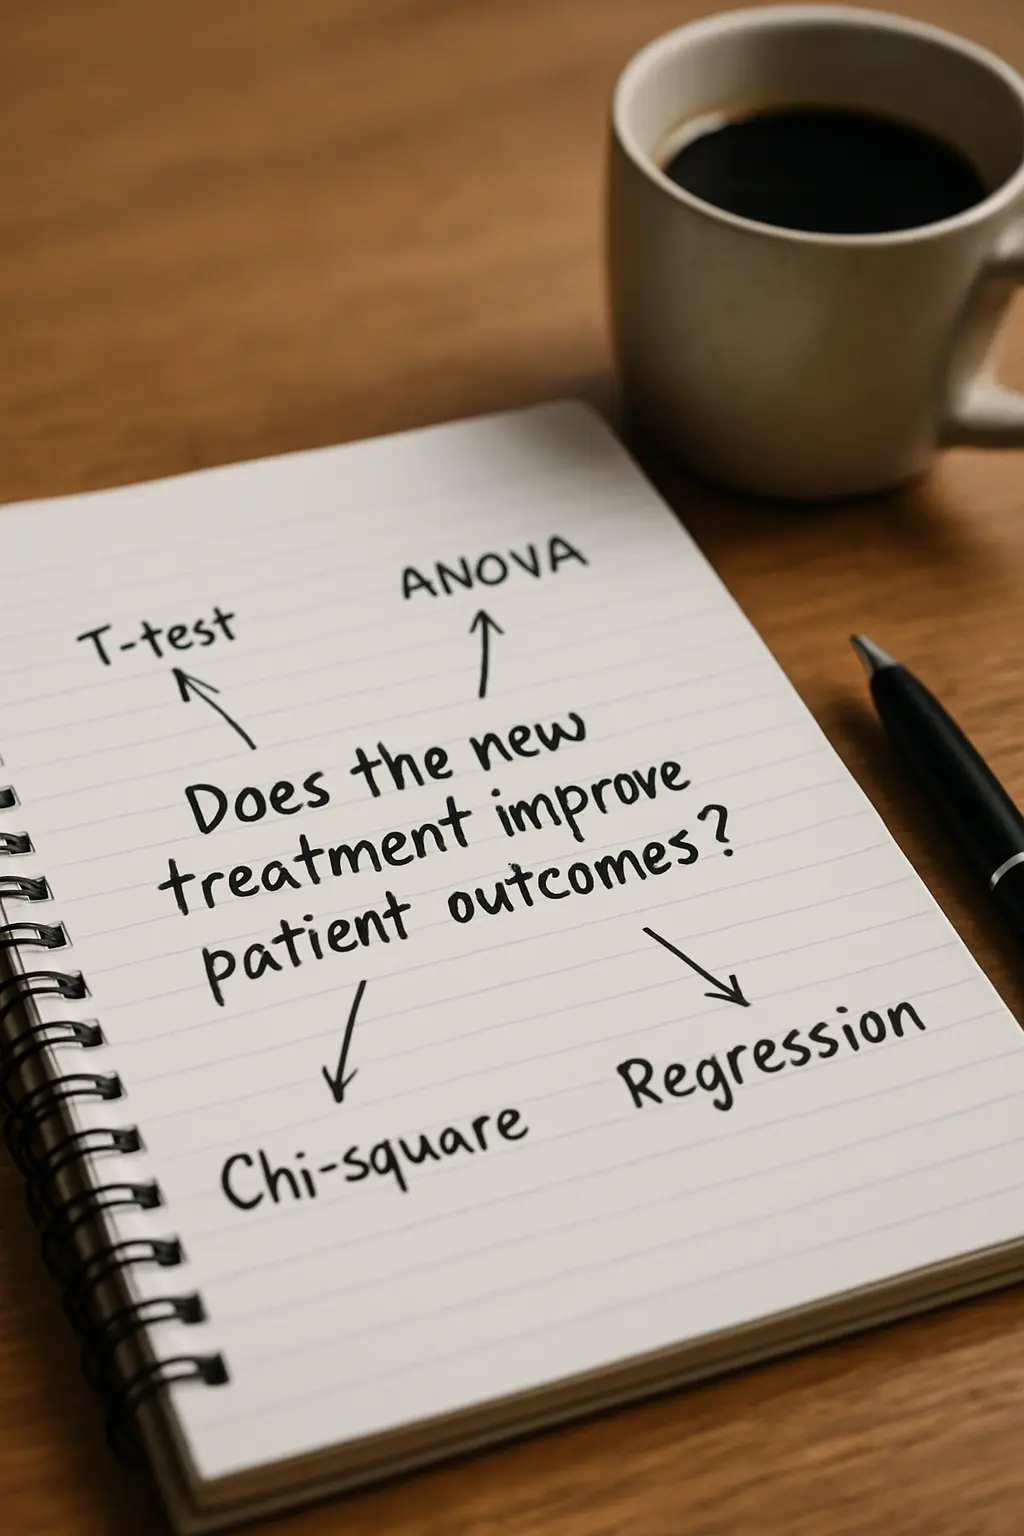
A common error in HRM dissertation proposals is choosing an impressive-sounding analysis (SEM is the usual candidate) before the research question actually needs it. A research question asking “is X related to Y” needs a correlation or simple regression. A question asking “does X explain Y after controlling for Z” needs multiple regression. A question asking “does X work through Y to affect Z” needs mediation analysis. A question asking “do groups differ” needs ANOVA or a t-test. Write the research question first, in plain language, then let it dictate the method — not the reverse.
When is multiple regression the right default?
Multiple regression is the standard choice for most quantitative South African HRM dissertations because most HRM research questions are of the form “which factors predict an outcome” — job satisfaction predicting turnover intention, leadership style predicting engagement, work-life balance predicting burnout. It requires a reasonably sized sample (a common rule of thumb is 10 to 15 cases per predictor variable, though check your supervisor’s expectation), and it produces results examiners in this field are accustomed to reading: standardised beta coefficients, R², and significance per predictor.
When does the study need mediation or moderation analysis?
Use mediation analysis (commonly run via Hayes’s PROCESS macro for SPSS) when the conceptual framework proposes that one variable explains the mechanism by which another affects a third — for example, testing whether employee engagement mediates the relationship between transformational leadership and job performance, rather than simply testing whether leadership and performance are related. Use moderation analysis when the framework proposes that a variable changes the strength or direction of a relationship — for example, whether tenure changes how strongly feedback frequency predicts motivation. Naming which of these your framework actually claims, in Chapter 1, before choosing the analysis in Chapter 3, keeps the two chapters aligned.
When is ANOVA or a t-test the right choice instead?
Choose ANOVA or a t-test when the research question compares groups rather than testing a relationship between continuous variables — engagement scores compared across departments, or burnout scores compared between employees with under and over five years’ tenure, for example. A common error is running a correlation when the actual research question is a group comparison, or vice versa; check which shape your research question actually takes before selecting the test. See the site’s general guide to choosing the right statistical test for the broader decision tree this fits into.
When does an HRM study need SEM?
Structural equation modelling (SEM or PLS-SEM) is appropriate when the conceptual framework proposes several relationships tested simultaneously as one model, rather than one relationship at a time — common at master’s or PhD level in HRM, less common in an honours-level mini-dissertation given the sample size and software learning curve it demands. If your framework diagram has more than two or three arrows and the study is intended to test the whole model at once rather than piece by piece, discuss SEM with your supervisor early, since it changes both the required sample size and the software budget.
How does this connect to the instruments you use?
The analysis method only works with data collected by an appropriate instrument — see the site’s own roundup of validated scales for an HRM dissertation for the instruments South African HRM studies actually use for job satisfaction, organisational commitment, perceived organisational support and leadership style. Confirm the measurement level your chosen instrument produces (most validated HRM scales produce ordinal Likert data treated as interval by convention) matches what your chosen analysis method requires before finalising either decision.
What about qualitative or mixed-methods HRM studies?
Not every HRM dissertation is quantitative — a qualitative study using interviews with HR managers about a policy’s implementation, for example, uses thematic or content analysis instead of any of the tests above. A mixed-methods HRM study might use a quantitative survey analysed by regression alongside qualitative interviews analysed thematically, with the two strands integrated in the discussion chapter. If your framework and research questions are qualitative or exploratory rather than testing a stated hypothesis, the quantitative tests in the table above simply do not apply — check your paradigm before assuming a quantitative default.
How should results actually be reported?
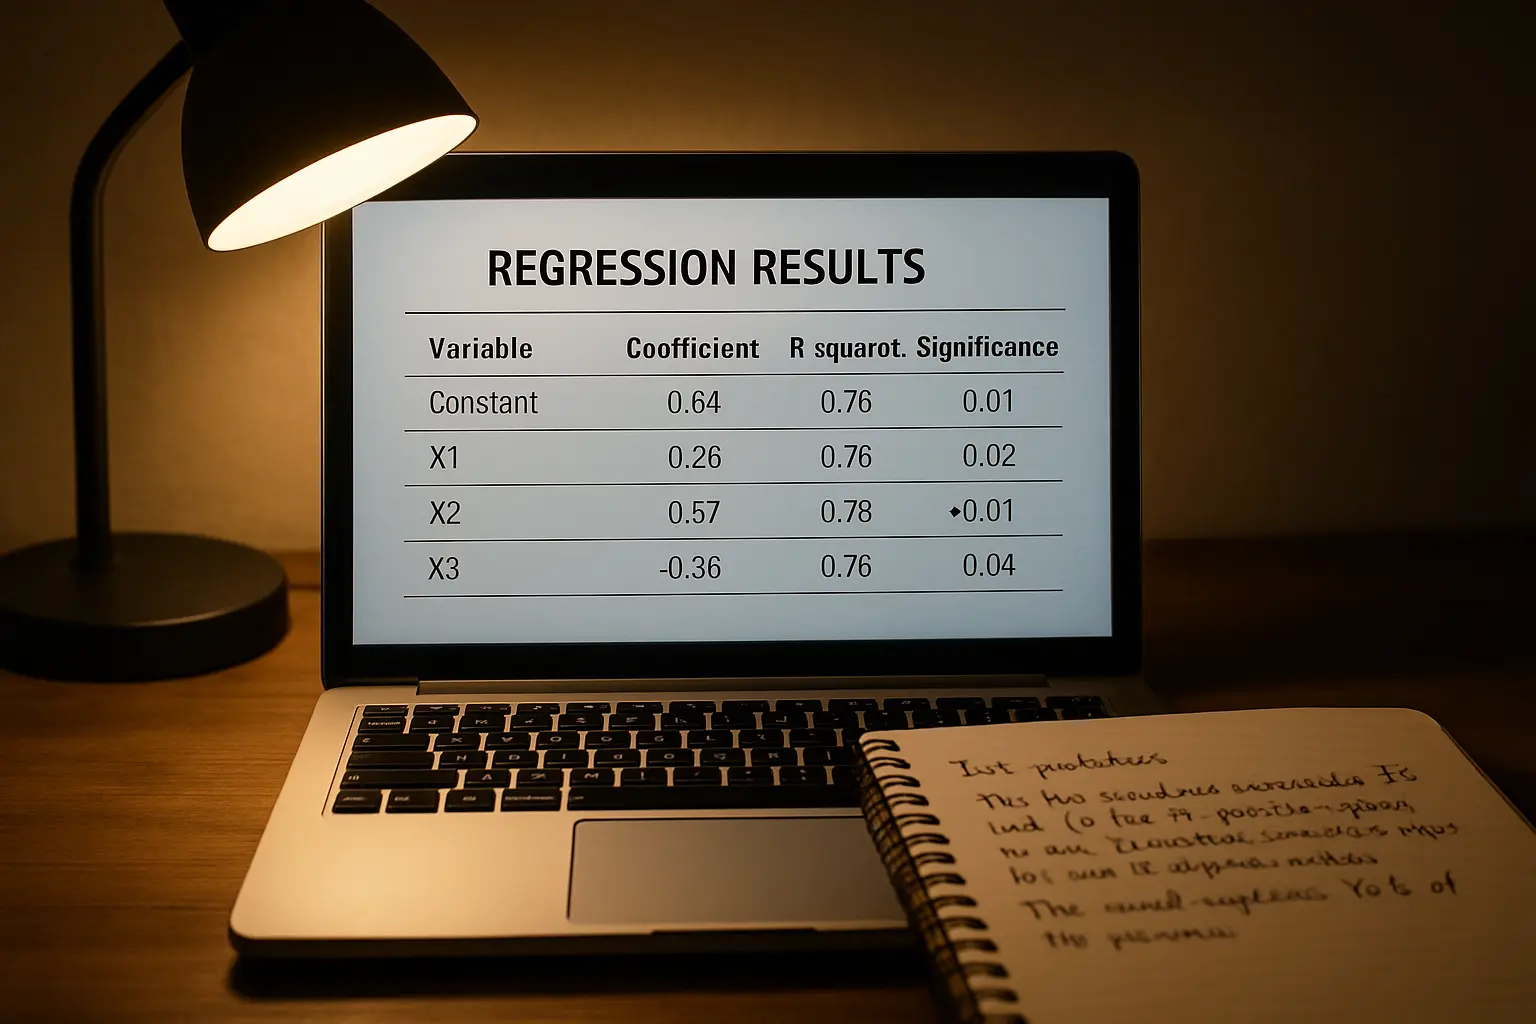
Whichever test is chosen, examiners in HRM dissertations expect the same discipline in the results chapter: the specific statistic (r, beta, F, or the path coefficient for SEM), the significance value, and the effect size — not just “the result was significant.” A regression table should report standardised betas for each predictor, the overall R² and adjusted R², and the model’s F-statistic and significance, not only which predictors were individually significant. Reporting a statistic without its significance value, or a significance value without the underlying effect size, is a common way results chapters lose marks even when the analysis itself was run correctly.
What common errors do examiners flag in this chapter?
A handful of patterns recur across South African HRM dissertations. Running a regression with too few cases relative to the number of predictors, producing an unstable or overfitted model. Interpreting a significant correlation as proof of causation — a correlation between engagement and performance does not establish that engagement causes performance, particularly in a cross-sectional design where all variables are measured at the same point in time. Failing to check the assumptions behind the chosen test (normality, multicollinearity among predictors, homogeneity of variance for ANOVA) before running it, then reporting results as if the assumptions were automatically met. And choosing an analysis method in Chapter 4 that does not actually match the hypothesis stated in Chapter 1 — a mismatch that a careful cross-check against your own instrument and hypothesis documentation catches before submission.
Planning the analysis before data collection, not after
Decide the analysis method during the proposal stage, not after the data is already collected — the choice of test affects the minimum sample size needed, the exact wording of the hypotheses, and even which items belong in the questionnaire. A common and avoidable problem is collecting data with a research design suited to correlation, then discovering during analysis that the research question actually needed a mediation test requiring additional measured variables that were never included in the questionnaire. Naming the analysis method explicitly in the proposal, and having a supervisor check it against the stated hypotheses, prevents this specific and costly rework — a mismatch found before data collection costs an afternoon of revision; the same mismatch found after data collection can cost weeks of re-fielding a questionnaire.
One clear recommendation
For a standard honours or master’s-level quantitative HRM mini-dissertation testing a direct relationship between two or three variables, multiple regression is the safest, best-supported default. Move to mediation or moderation analysis only where your conceptual framework explicitly proposes a mechanism or a conditional effect, not because the technique looks more sophisticated. Reserve SEM for a study genuinely designed around testing a full multi-relationship model, with the sample size and software access confirmed before you commit to it — the technique should match the ambition of the research question, not the other way around.
Matching the analysis to the question this precisely is exactly the kind of structuring work Tesify helps with, while the actual data, the actual results and the actual interpretation stay entirely your own.
Frequently asked questions
Can I use SPSS for all of these analyses?
SPSS covers correlation, regression, ANOVA and t-tests natively, and mediation/moderation via the free PROCESS macro add-on. Full SEM in SPSS requires the separate AMOS module — check whether your institution licenses AMOS before assuming it is included.
Is R a realistic free alternative to SPSS for an HRM dissertation?
Yes for most of the analyses above, including SEM via the lavaan package, but R has a steeper learning curve than SPSS’s point-and-click interface — factor in the time to learn it if you have not used it before, particularly close to a submission deadline, and check whether your department already licenses SPSS before investing time in R for its own sake.
How do I know if my sample is large enough for regression?
Beyond the rule-of-thumb ratio of cases to predictors, a formal power analysis (using G*Power or a comparable tool) gives a more defensible minimum sample size for your specific number of predictors and expected effect size — discuss the expected effect size assumption with your supervisor before running it, since an unrealistic assumption produces a misleadingly small target sample size.
What if my data fails the normality assumption for regression?
Check for outliers and data-entry errors first, then consider a non-parametric alternative or a data transformation if the violation is genuine and the sample is small — a large enough sample can often tolerate moderate non-normality under the central limit theorem, but confirm this reasoning with your supervisor rather than defaulting to it automatically.
Can I combine ANOVA and regression in the same study?
Yes — many HRM dissertations use ANOVA to answer a group-comparison sub-question and regression to answer a relationship sub-question within the same study, as long as each test is matched to its own specific research question.
Does my supervisor need to approve the analysis method before data collection?
Check your department’s process, but naming and justifying the analysis method in the proposal — rather than deciding only once the data is in — is strong practice regardless, since a supervisor can flag a sample-size or measurement-level mismatch before it becomes a rework problem later in the study.
What if two variables in my HRM study are correlated with each other, not just with the outcome?
Check for multicollinearity among your predictors before finalising a multiple regression model — highly correlated predictors can distort individual beta coefficients even when the overall model fits well, and most statistical software reports a variance inflation factor (VIF) diagnostic for exactly this check — a VIF above roughly 5 to 10 is generally treated as a signal to reconsider the model, though conventions vary by field and software documentation.