You have a box of completed questionnaires, or a spreadsheet exported from an online survey, and a licence for SPSS that your university provides. Between that and a results chapter sit ten steps, and skipping any of them is what produces an analysis an examiner can pick apart. This guide walks a South African honours or master’s student through all ten, with the expected output stated at each one.
How to analyse questionnaire data in SPSS, step by step
Step 1: Build a codebook before you open SPSS
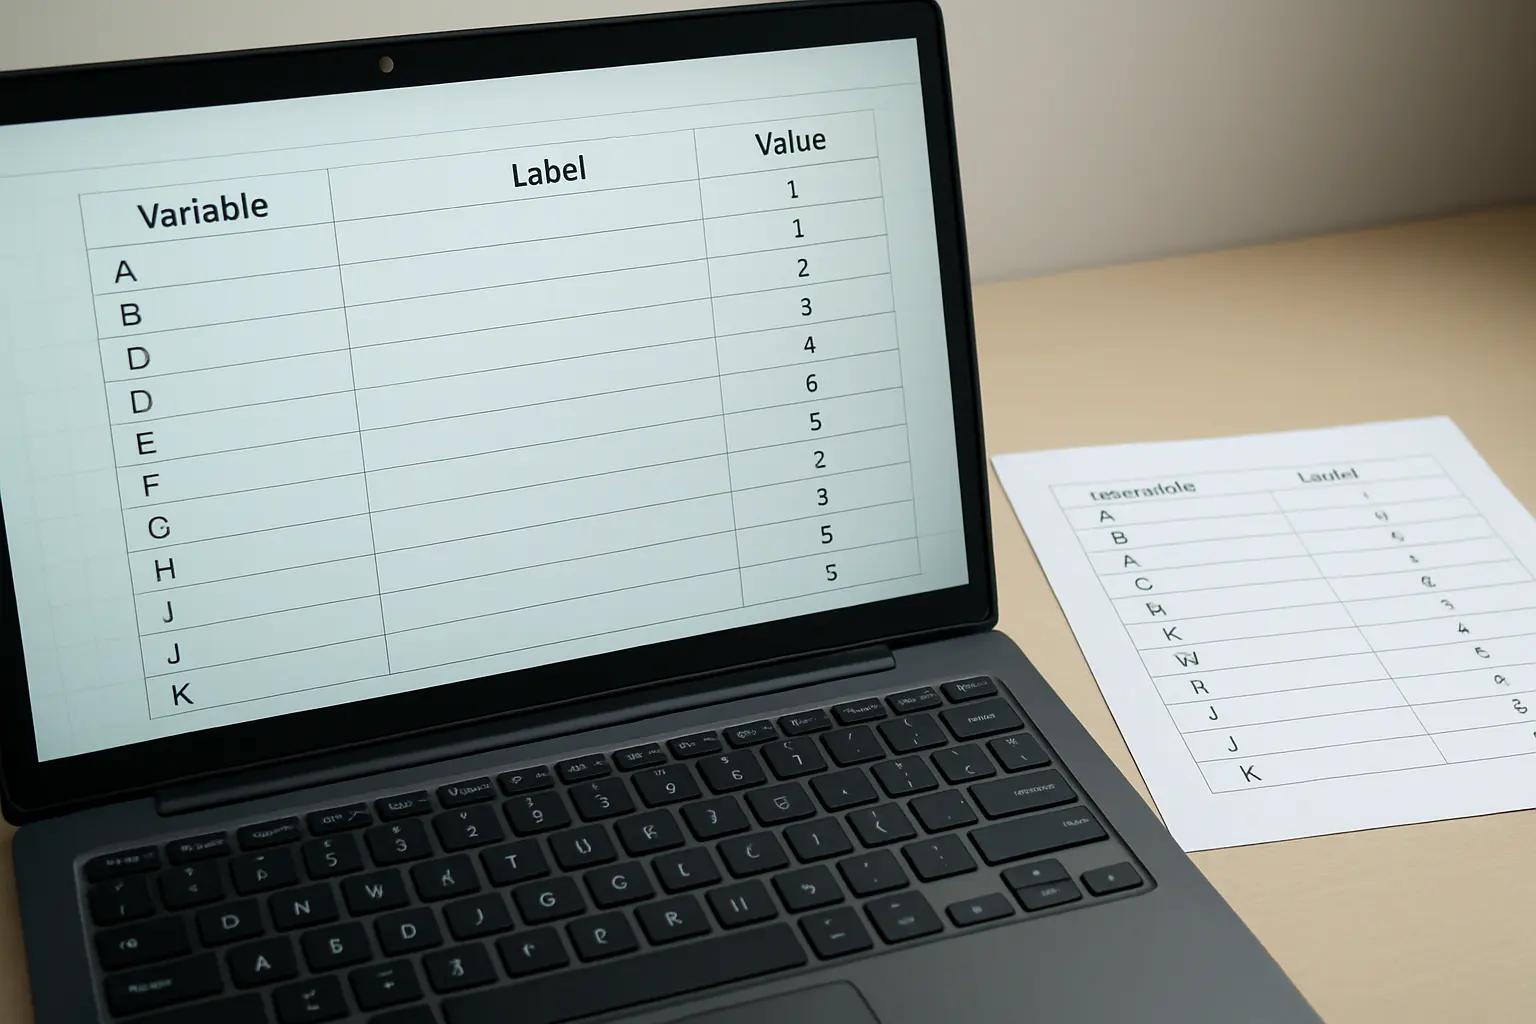
A codebook is a plain table listing, for every question on your instrument: the variable name you will use, the full question text, the response options, and the number assigned to each option. Build it in a spreadsheet before capturing a single response. It takes an hour and it prevents the failure that costs students weeks — reaching analysis and no longer being certain whether 1 meant “strongly agree” or “strongly disagree” on question 14.
Expected output: a one-page codebook. It goes into your appendices, and your examiner will look for it.
Step 2: Define your variables in Variable View, not Data View
Open SPSS and go to Variable View first. For every variable set: Name (short, no spaces), Type (usually Numeric), Label (the readable question text — this is what prints in your output tables, so write it properly), Values (the code-to-meaning mapping from your codebook), Missing (declare your missing-value code, commonly 99 or blank), and Measure (Nominal, Ordinal or Scale).
The Measure column matters more than students realise: SPSS uses it to decide which analyses and charts it will offer you, and a Likert item left as Nominal will quietly hide the options you need. Set it deliberately for every variable.
Expected output: a fully defined variable set with labels that will make your output tables readable without a decoder ring.
Step 3: Capture or import the data
If you collected on paper, capture into Data View: one row per participant, one column per variable, and an ID number in the first column so every row traces back to a physical questionnaire. If you collected online, export to Excel or CSV and use File > Import Data. Either way, check that the number of rows equals the number of responses you actually have before going further — a mismatch here propagates into everything downstream.
Expected output: a dataset whose row count you have verified against your response log.
Step 4: Clean the data before you analyse it
Run Analyze > Descriptive Statistics > Frequencies on every variable at once. You are not interpreting anything yet; you are hunting for four specific problems:
- Impossible values — a 7 in a variable coded 1 to 5, an age of 200. These are capture errors. Trace them back to the questionnaire and correct them.
- Unexpected missing data — a question far more people skipped than the rest usually indicates a badly worded or sensitive item, and it belongs in your limitations.
- Straight-lining — a respondent who selected the same option for every item on a long scale may not have engaged with it.
- Duplicates — especially in online collection, where a participant may have submitted twice.
Decide and record your rule for missing data before you apply it — whether you exclude cases from particular analyses, or exclude a case entirely above a threshold of missing items. Whatever you choose, it goes in the methodology chapter. Deleting inconvenient cases without a stated rule is the single most common integrity problem in student quantitative work.
Expected output: a clean dataset, plus a short written record of every cleaning decision and how many cases each affected.
Step 5: Reverse-score the negatively worded items
Most validated scales include items phrased in the opposite direction to catch inattentive responding. Those must be flipped before you combine anything, or your scale score will be meaningless. Use Transform > Recode into Different Variables — always into a different variable, never over the original, so the raw data stays intact and your work stays auditable. On a five-point scale, 1 becomes 5, 2 becomes 4, 3 stays 3, and so on.
Expected output: new reversed variables, clearly named (for example Q7_R), with the originals untouched.
Step 6: Compute your scale scores
If your instrument measures constructs through several items each, combine them with Transform > Compute Variable — typically the mean of the item set, which keeps the score on the original response metric and is easier to interpret than a sum. Build one computed variable per construct, using the reversed versions where applicable.
Expected output: one score per construct per participant, ready for analysis.
Step 7: Check the reliability of each scale
Before you test anything with a scale, show that the scale held together in your sample. Run Analyze > Scale > Reliability Analysis, enter the items for one construct, and read Cronbach’s alpha. A value of about 0,70 or above is the conventional threshold for acceptable internal consistency, though the convention is applied far more mechanically than its originators intended, and a very high alpha on a short scale can simply mean you asked the same question repeatedly.
Report alpha for every multi-item scale you use. If one comes out low, the “Cronbach’s Alpha if Item Deleted” column tells you whether a single misbehaving item is responsible — but dropping items must be reported and justified, not done silently until the number looks good.
Expected output: an alpha for each scale, recorded for your results chapter.
Step 8: Describe the sample and the variables
Now produce the descriptive layer that opens every results chapter: frequencies and percentages for your categorical demographics, and means and standard deviations for your continuous variables, via Analyze > Descriptive Statistics. Also look at the shape of your distributions — histograms and the skewness and kurtosis values — because that is what determines whether the test you planned is the test you can run.
Expected output: a sample-description table and a distribution check for every outcome variable.

Step 9: Run the inferential test your design requires
One test, chosen in advance, matched to your research question — not a sweep through the menus until something returns a small p value. If you have not settled this, our guide to choosing a statistical test resolves it in three questions, and the sample you have will determine what the result can carry, which our guide to sample size covers.
Check the test’s assumptions as part of running it, and request the effect size wherever SPSS offers it — the dialogue boxes for the common tests now include effect-size options, and a results chapter reporting significance without magnitude is incomplete. If an assumption fails, do not proceed as though it passed; move to the appropriate alternative and say why.
Expected output: your test output, with assumption checks and effect sizes, saved as an SPSS output file.
Step 10: Keep a syntax file — this is the step that saves you
Every SPSS dialogue box has a Paste button. It writes the command you just built into a syntax window instead of only running it. Paste everything, save the syntax file, and you have a complete, re-runnable record of your entire analysis. Two months later, when your supervisor asks why the sample in Table 4 is 187 and not 194, the syntax answers instantly. If you discover a capture error late, you re-import the corrected data and re-run the file rather than repeating forty clicks and hoping you repeat them identically.
Expected output: a saved .sps syntax file that reproduces your analysis from raw data to final table.
How do you cite SPSS in your dissertation?
Your methodology chapter must name the software and its version — get the exact version from Help > About in your own installation rather than copying a number from a website, because your faculty expects the version you actually used. The Harvard form, following the pattern your faculty guide sets out for software and corporate authors:
IBM Corp. [year of your version]. IBM SPSS Statistics for Windows, Version [your version number]. Armonk, NY: IBM Corp.
UCT, Wits and Stellenbosch each publish their own Harvard variant and the punctuation differs between them, so check the exact commas and italics against your own faculty guide — our Harvard vs APA comparison explains how to work out which rules govern you, and a reference manager will hold the entry once you have built it correctly.
Where do South African students most often lose marks in this process?
Four places, all avoidable. Undocumented cleaning: cases vanish between the response log and the analysis with no explanation, and the examiner has no way to tell whether the removal was principled. Unreported reverse-scoring: a scale score computed without flipping the negative items produces findings that are simply wrong. Missing reliability: multi-item scales analysed with no alpha reported, so nobody knows whether the instrument worked in this sample. And running the analysis entirely through the menus with no syntax, which makes every question about the analysis unanswerable.
None of these are difficulty problems. They are record-keeping problems, and they are why the codebook in Step 1 and the syntax file in Step 10 are the two steps students skip and the two steps that matter most under examination — particularly in South Africa, where external examiners assess the document without you in the room and cannot ask you a clarifying question.
What comes after the output?
Turning that output into prose is a separate task with its own conventions — which tables belong in the chapter, which belong in an appendix, and how a test result is written in running text. Do not paste raw SPSS tables into your dissertation; they are working documents, not publication tables. Draft the analysis while the decisions are fresh: Tesify holds your chapter structure and sources in one project, so the methodology paragraph describing these ten steps gets written the week you perform them rather than reconstructed from memory at submission.
FAQ
Is SPSS free for South African students?
Most South African universities hold a site licence and make SPSS available to registered students, often through the IT services or library software portal, sometimes only while you are registered. Check your own institution’s software page — terms, home-use rights and licence expiry differ between universities.
Can I analyse questionnaire data in Excel instead?
For descriptive statistics, yes. For inferential tests, reliability analysis and regression, a dedicated statistics package is far safer and much easier to document. Free alternatives exist if your institution does not provide SPSS.
What do I do about missing data?
Decide a rule in advance, apply it consistently and report it: which analyses exclude which cases, and at what threshold a case is dropped entirely. The rule matters less than stating it.
How do I know if my scale is reliable?
Run a reliability analysis and report Cronbach’s alpha for each multi-item scale, with roughly 0,70 as the conventional acceptability threshold. Report the value you obtained rather than only the ones that met it.
Should I use the mean or the sum for a scale score?
Either is defensible. The mean keeps the score on the original response scale and handles a missing item more gracefully, which is why it is the more common choice in questionnaire research. State which you used.
Do I have to check assumptions if my sample is large?
Yes — check and report them regardless. Large samples make some tests more robust to some violations, but “the sample was large” is not a substitute for having looked.
Can I paste SPSS output tables straight into my dissertation?
No. SPSS output is a working format; your dissertation needs tables formatted to your faculty’s standard, containing only the statistics a reader needs.
What if I find an error after I have written the chapter?
Correct the data, re-run your syntax file and regenerate the affected tables. This is precisely the situation the syntax file in Step 10 exists for, and it turns a week of rework into an afternoon.
Should I keep the original questionnaires after capture?
Yes — your ethics approval will specify a retention period and secure storage conditions for both the paper originals and the dataset. Check the conditions attached to your own clearance.